Neuroprotection by a mitochondria-targeted drug in a Parkinson's disease model - PubMed (original) (raw)
Neuroprotection by a mitochondria-targeted drug in a Parkinson's disease model
Anamitra Ghosh et al. Free Radic Biol Med. 2010.
Abstract
The objective of this study was to assess the neuroprotective effects of a mitochondria-targeted antioxidant, Mito-Q(10), the coenzyme-Q analog attached to a triphenylphosphonium cation that targets the antioxidant to mitochondria, in experimental models of Parkinson's disease (PD). Primary mesencephalic neuronal cells and cultured dopaminergic cells were treated with 1-methyl-4-phenylpyridinium (MPP(+)), an active metabolite of the neurotoxin 1-methyl-4-phenyl-1,2,3,6-tetrahydropyridine (MPTP), and mice were used for testing the efficacy of Mito-Q(10). MPP(+) treatment caused a dose-dependent loss of tyrosine hydroxylase and membrane potential and an increase in caspase-3 activation in dopaminergic cells, which were reversed by Mito-Q(10). MPTP treatment induced a loss of striatal dopamine and its metabolites, inactivation of mitochondrial aconitase in the substantia nigra, and a loss of locomotor activity in mice. Treatment with Mito-Q(10) significantly inhibited both MPP(+)- and MPTP-induced neurotoxicity in cell culture and mouse models. Collectively, these results indicate that mitochondrial targeting of antioxidants is a promising neuroprotective strategy in this preclinical mouse model of PD.
Copyright © 2010. Published by Elsevier Inc.
Figures
Fig. 1
Inhibition of tyrosine hydroxylase protein in rat MDNs treated with MPP+. (A) MDNs were treated with various concentrations of MPP+ for 48 h, and the TH levels were determined by Western blotting using the monoclonal antibodies raised against TH and β-actin, followed by the secondary antibody coupled to horseradish peroxidase. Bands were visualized by an ECL detection system. The band intensities were calculated by densitometric analysis using Alpha Imager software, and the ratio of TH/β-actin was normalized to 100% in controls. (B) Under treatment conditions similar to those for (A), the survival of the dopamine neurons in cultures was visualized by immunocytochemistry using the polyclonal antibodies raised against TH and secondary antibody coupled to FITC. Fluorescence images were obtained using a Nikon fluorescence microscope equipped with Metamorph software. The numbers of surviving neurons with intact neurites were counted from 20 fields of view and the total numbers of neurons obtained in controls were normalized to 100%. (C) The densitometric analysis of the data shown in (B). (D) As described for (B), the survival of the dopamine neurons was visualized by immunohistochemistry. MDNs were treated with MPP+, MPP+ and Mito-Q10, and Mito-Q10 for 48 h. Data shown are the means±SD of three separate experiments. *P < 0.05 and **P<0.01 compared to controls.
Fig. 2
Mito-Q10 suppressed MPP+-induced loss of mitochondrial membrane potential. (A) N27 cells were incubated with MPP+ in the presence and absence of Mito-Q10 for 48 h. Cells were treated for 30 min with JC-1 (3 μl/ml) and washed twice with PBS, and the fluorescence images obtained under FITC and rhodamine filter settings were overlaid. (B) The number of cells demonstrating aggregated versus monomeric JC-1 probe was quantified by measuring the ratio between the fluorescence emission at 590 (orange) and 530 nm (green) in a Nikon fluorescence microscope using Metamorph software, and the values obtained under control conditions were normalized to 1. Data shown are the means±SD of three separate experiments. *P<0.05 and **P<0.01 compared to controls; #P<0.05 compared to MPP+-treated group.
Fig. 3
The protective effects of Mito-Q10 on MPP+-induced toxicity in the rat N27 cell model. (A) N27 cells were treated with 150 μM MPP+ in the presence and absence of Mito-Q10 for 48 h. The cytotoxicity was measured using the Sytox dye. (B) The densitometric results of the data shown in (A). (C) After the termination of incubation, caspase-3-like activity was measured in the cell lysate using the substrate DEVD-AFC as described under Materials and methods. (D) Same as (B) except that the effects of Mito-Q10 were compared with those of Co-Q. Data shown are the means±SD of four separate experiments. *P<0.01 and **P<0.001, ***P<0.0001 compared to controls; #P<0.001 compared to MPP+-treated group.
Fig. 4
Pretreatment with Mito-Q10 restores dopamine levels in MPP+-treated neuronal cells. (A) MDNs were treated with various concentrations of MPP+. After the termination of incubation, the cells were washed three times with DPBS and lysed in 200 μl of 0.1 M perchloric acid. Dopamine levels were determined from 50-μl aliquots of clarified supernatant using an HPLC method with amperometric–CoulArray detection and a C18 reverse-phase column and TM-50 solvent (flow rate, 0.6 ml/min) as described under Materials and methods. Dopamine levels were normalized to the total protein and the values were calculated using the dopamine standard. (B) Dopamine levels were determined after treating MDNs with MPP+ (25 μM), MPP+ plus Mito-Q10, and Mito Q. Data shown are the means±SD of three separate experiments. **P<0.01 compared to controls; #P<0.01 compared to MPP+-treated group.
Fig. 5
Effects of Mito-Q10 on the striatal dopamine and dopamine-derived metabolites in subacute MPTP-treated mice. Mice were administered Mito-Q10 (4 mg/kg) by oral gavage for 1 day (pretreatment before MPTP), 5 days (cotreatment with MPTP), and 7 days (posttreatment after MPTP). MPTP (25 mg/kg/day) was injected daily intraperitoneally for 5 days starting on day 2 and ending on day 7. Control mice received saline at the same dose. Seven days after the last MPTP injection, mice were sacrificed and (A) dopamine, (B) DOPAC, and (C) HVA were measured from striatum by HPLC. Data are means+SEM of six mice per group. *P<0.001 vs control; **P<0.001 vs MPTP; #P<0.05 vs MPTP; @P<0.01 vs MPTP.
Fig. 6
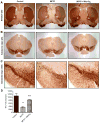
Effects of Mito-Q10 on nigrostriatum in subacute MPTP-treated mice. Mice were administered Mito-Q10 (4 mg/kg dose) by oral gavage for 1 day (pretreatment before MPTP administration), 5 days (cotreatment with MPTP), and 7 days (posttreatment after MPTP). MPTP (20 mg/kg) was administered intraperitoneally via a single dose daily starting on day 2 for 5 days. Control mice received saline at the same dose. Mice were perfused after 7 days of MPTP treatment and TH–DAB immunostaining was performed in (A) striatum (2× original magnification), (B) substantia nigra (2× original magnification), and (C) substantia nigra (10× original magnification). (D) Stereological counts of TH-positive neurons in the substantia nigra. Data are means±SEM of five or six mice per group; *P<0.01 vs control, **P<0.05 vs MPTP.
Fig. 7
Effects of Mito-Q10 on MPTP-induced locomotor deficits. Mice were administered Mito-Q10 (4 mg/kg dose) by oral gavage for 1 day (pretreatment before MPTP administration), 5 days (cotreatment with MPTP), and 7 days (posttreatment after MPTP). MPTP (25 mg/kg) was administered at a single dose daily intraperitoneally starting on day 2 for 5 days. Control mice received saline at the same dose. The locomotor activities were measured using a VersaMax analyzer and rotarod, 5 days after the last MPTP injection. (A) Moving track of mice (VersaPlot); (B) horizontal activity; (C) vertical activity; (D) total distance traveled (cm); (E) total movement time (s); (F) total rest time (s); (G) rearing activity; (H) time spent on rotarod (s) at 20 rpm. Data are means+SEM of eight mice per group. *P<0.001 vs control; **P<0.05 vs MPTP; #P<0.01 vs control; @P<0.05 vs control.
Fig. 8
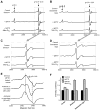
The low-temperature EPR spectra from mouse brain tissues. (A) EPR spectra were obtained at 10–15 K from striatal tissues isolated from MPTP- and MPTP plus Mito-Q10-treated mice. (B) Same as (A), except that tissues were isolated from the substantia nigra of mice. (C) Expansion of the region inside the box shown in (A). (D) Expansion of the region inside the box shown in (B). (E) EPR spectra of authentic [3Fe–4 S]+ generated from cytosolic and mitochondrial aconitases. For the sake of comparison, the expanded spectrum at the region _g_=2.01–2.03 obtained from the SN tissues isolated from MPTP-treated mice is included. (F) Bar graphs showing the spectral intensities of the signal obtained at _g_=2.01–2.03 from tissues isolated from the various regions of the brain from mice treated with MPTP and MPTP plus Mito-Q10. Spectra were recorded at 10 K.
Similar articles
- Mitoapocynin Treatment Protects Against Neuroinflammation and Dopaminergic Neurodegeneration in a Preclinical Animal Model of Parkinson's Disease.
Ghosh A, Langley MR, Harischandra DS, Neal ML, Jin H, Anantharam V, Joseph J, Brenza T, Narasimhan B, Kanthasamy A, Kalyanaraman B, Kanthasamy AG. Ghosh A, et al. J Neuroimmune Pharmacol. 2016 Jun;11(2):259-78. doi: 10.1007/s11481-016-9650-4. Epub 2016 Feb 2. J Neuroimmune Pharmacol. 2016. PMID: 26838361 Free PMC article. - Ganoderma lucidum extract ameliorates MPTP-induced parkinsonism and protects dopaminergic neurons from oxidative stress via regulating mitochondrial function, autophagy, and apoptosis.
Ren ZL, Wang CD, Wang T, Ding H, Zhou M, Yang N, Liu YY, Chan P. Ren ZL, et al. Acta Pharmacol Sin. 2019 Apr;40(4):441-450. doi: 10.1038/s41401-018-0077-8. Epub 2018 Jul 10. Acta Pharmacol Sin. 2019. PMID: 29991712 Free PMC article. - Effects of the root bark of Paeonia suffruticosa on mitochondria-mediated neuroprotection in an MPTP-induced model of Parkinson's disease.
Kim HG, Park G, Piao Y, Kang MS, Pak YK, Hong SP, Oh MS. Kim HG, et al. Food Chem Toxicol. 2014 Mar;65:293-300. doi: 10.1016/j.fct.2013.12.037. Epub 2014 Jan 2. Food Chem Toxicol. 2014. PMID: 24389454 - Experimental models of chemically induced Parkinson's disease in zebrafish at the embryonic larval stage: a systematic review.
Briñez-Gallego P, da Costa Silva DG, Cordeiro MF, Horn AP, Hort MA. Briñez-Gallego P, et al. J Toxicol Environ Health B Crit Rev. 2023 May 19;26(4):201-237. doi: 10.1080/10937404.2023.2182390. Epub 2023 Mar 1. J Toxicol Environ Health B Crit Rev. 2023. PMID: 36859813 - How Parkinsonian toxins dysregulate the autophagy machinery.
Dagda RK, Das Banerjee T, Janda E. Dagda RK, et al. Int J Mol Sci. 2013 Nov 8;14(11):22163-89. doi: 10.3390/ijms141122163. Int J Mol Sci. 2013. PMID: 24217228 Free PMC article. Review.
Cited by
- Mitochondrial Medicine: A Promising Therapeutic Option Against Various Neurodegenerative Disorders.
Almikhlafi MA, Karami MM, Jana A, Alqurashi TM, Majrashi M, Alghamdi BS, Ashraf GM. Almikhlafi MA, et al. Curr Neuropharmacol. 2023;21(5):1165-1183. doi: 10.2174/1570159X20666220830112408. Curr Neuropharmacol. 2023. PMID: 36043795 Free PMC article. Review. - Mitochondrial dysfunction in Parkinson's disease - a key disease hallmark with therapeutic potential.
Henrich MT, Oertel WH, Surmeier DJ, Geibl FF. Henrich MT, et al. Mol Neurodegener. 2023 Nov 11;18(1):83. doi: 10.1186/s13024-023-00676-7. Mol Neurodegener. 2023. PMID: 37951933 Free PMC article. Review. - Compartment specific mitochondrial dysfunction in Drosophila knock-in model of ALS reversed by altered gene expression of OXPHOS subunits and pro-fission factor Drp1.
Nemtsova Y, Steinert BL, Wharton KA. Nemtsova Y, et al. Mol Cell Neurosci. 2023 Jun;125:103834. doi: 10.1016/j.mcn.2023.103834. Epub 2023 Mar 1. Mol Cell Neurosci. 2023. PMID: 36868541 Free PMC article. - MANF improves the MPP+/MPTP-induced Parkinson's disease via improvement of mitochondrial function and inhibition of oxidative stress.
Liu Y, Zhang J, Jiang M, Cai Q, Fang J, Jin L. Liu Y, et al. Am J Transl Res. 2018 May 15;10(5):1284-1294. eCollection 2018. Am J Transl Res. 2018. PMID: 29887945 Free PMC article. - Mito-metformin protects against mitochondrial dysfunction and dopaminergic neuronal degeneration by activating upstream PKD1 signaling in cell culture and MitoPark animal models of Parkinson's disease.
Ay M, Charli A, Langley M, Jang A, Padhi P, Jin H, Anantharam V, Kalyanaraman B, Kanthasamy A, Kanthasamy AG. Ay M, et al. Front Neurosci. 2024 Feb 21;18:1356703. doi: 10.3389/fnins.2024.1356703. eCollection 2024. Front Neurosci. 2024. PMID: 38449738 Free PMC article.
References
- Burns RS, Chiueh CC, Markey SP, Ebert MH, Jacobowitz DM, Kopin IJ. A primate model of parkinsonism: selective destruction of dopaminergic neurons in the pars compacta of the substantia nigra by N-methyl-4-phenyl-1, 2, 3, 6-tetrahydropyridine. Proc Natl Acad Sci USA. 1983;80:4546–4550. - PMC - PubMed
- Dawson TM, Dawson VL. Molecular pathways of neurodegeneration in Parkinson’s disease. Science. 2003;302:819–822. - PubMed
- Parker WD, Jr, Boyson SJ, Parks JK. Abnormalities of the electron transport chain in idiopathic Parkinson’s disease. Ann Neurol. 1989;26:719–723. - PubMed
- Fahn S, Przedborski S. Parkinsonism. In: Rowland LP, editor. Merritt’s Neurology. Lippincott, Williams & Wilkins; New York: 2002. pp. 679–695.
- Greenamyre JT, Betarbet R, Sherer T, Panov A. Parkinson’s disease, pesticides and mitochondrial function. Trends Neurosci. 2001;24:247.
Publication types
MeSH terms
Substances
LinkOut - more resources
Full Text Sources
Other Literature Sources
Research Materials


