Incomplete recovery and individualized responses of the human distal gut microbiota to repeated antibiotic perturbation - PubMed (original) (raw)
. 2011 Mar 15;108 Suppl 1(Suppl 1):4554-61.
doi: 10.1073/pnas.1000087107. Epub 2010 Sep 16.
Affiliations
- PMID: 20847294
- PMCID: PMC3063582
- DOI: 10.1073/pnas.1000087107
Incomplete recovery and individualized responses of the human distal gut microbiota to repeated antibiotic perturbation
Les Dethlefsen et al. Proc Natl Acad Sci U S A. 2011.
Abstract
The indigenous human microbiota is essential to the health of the host. Although the microbiota can be affected by many features of modern life, we know little about its responses to disturbance, especially repeated disturbances, and how these changes compare with baseline temporal variation. We examined the distal gut microbiota of three individuals over 10 mo that spanned two courses of the antibiotic ciprofloxacin, analyzing more than 1.7 million bacterial 16S rRNA hypervariable region sequences from 52 to 56 samples per subject. Interindividual variation was the major source of variability between samples. Day-to-day temporal variability was evident but constrained around an average community composition that was stable over several months in the absence of deliberate perturbation. The effect of ciprofloxacin on the gut microbiota was profound and rapid, with a loss of diversity and a shift in community composition occurring within 3-4 d of drug initiation. By 1 wk after the end of each course, communities began to return to their initial state, but the return was often incomplete. Although broadly similar, community changes after ciprofloxacin varied among subjects and between the two courses within subjects. In all subjects, the composition of the gut microbiota stabilized by the end of the experiment but was altered from its initial state. As with other ecosystems, the human distal gut microbiome at baseline is a dynamic regimen with a stable average state. Antibiotic perturbation may cause a shift to an alternative stable state, the full consequences of which remain unknown.
Conflict of interest statement
The authors declare no conflict of interest.
Figures
Fig. 1.
Heat map displaying the relative abundance of refOTUs in three prominent clades of bacteria. Relative abundance is based on the number of pyrosequencing reads clustering into each refOTU after normalizing the number of reads per sample. Clades are indicated on the left; Ba is all 174 refOTUs within the Bacteroidetes phylum. Within the Firmicutes phylum (Fi), the figure shows clades within the Lachnospiraceae (573 refOTUs) and the Ruminococcaceae (211 refOTUs) that contain the prominent genera named on the right. Each column corresponds to a sample in sequential order for each of subjects D, E, and F, with the times of Cp administration indicated by white bars at the top and bottom of the heat map. Each row corresponds to 1 refOTU, listed in phylogenetic order as defined by the Silva 100 reference tree. Color intensity is proportional to the logarithm of refOTU abundance from 0 to 200 reads as indicated by the scale; color is saturated for abundance of 200 or more.
Fig. 2.
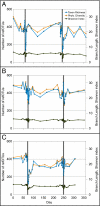
Three measures of biological diversity for samples from subjects D (A), E (B), and F (C). Calculations were made after rarefying to an equal number of reads for all samples to control for unequal sampling effort. Narrow gray rectangles indicate the 5-d Cp courses; daily sampling around these times allowed visualization of daily fluctuations in diversity parameters that were not evident during less frequent sampling. RefOTU richness (number of refOTUs observed per sample) is shown on the left y axis; phylogenetic diversity (PD; total branch length of the phylogenetic tree relating all refOTUs in the sample) and the Shannon index of diversity are shown on the right y axis. The x axis reflects experiment day.
Fig. 3.
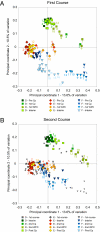
PCoA of unweighted UniFrac distances, a phylogenetically aware measure of intersample (β) diversity. A covers the period encompassing the first Cp, with samples before Cp (pre-Cp), during the first Cp course (first Cp), during the first week post-Cp (first WPC), and in the interim period between Cp courses (interim) progressing from darker to lighter shades. B covers the second Cp period, with interim samples in the darkest shades and the second Cp course, second WPC, and post-Cp periods becoming progressively lighter. Data points from A are also shown on B with small gray symbols to facilitate comparisons between the two parts of the experiment. Numbers adjacent to some samples track the Cp perturbation by indicating the number of days elapsed since the start of Cp administration; missing numbers indicate that samples were not collected on those days.
Fig. 4.
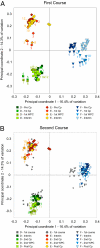
Distance-based redundancy analysis (15) of Bray–Curtis intersample distances calculated with log2-transformed abundance data. As in Fig. 3, A and B show samples surrounding the first and second Cp course respectively, with interim samples appearing in both panels. Symbol color and numbering are as described for Fig. 3.
Similar articles
- The pervasive effects of an antibiotic on the human gut microbiota, as revealed by deep 16S rRNA sequencing.
Dethlefsen L, Huse S, Sogin ML, Relman DA. Dethlefsen L, et al. PLoS Biol. 2008 Nov 18;6(11):e280. doi: 10.1371/journal.pbio.0060280. PLoS Biol. 2008. PMID: 19018661 Free PMC article. - Gut microbiota dynamics and functionality in Reticulitermes grassei after a 7-day dietary shift and ciprofloxacin treatment.
Berlanga M, Palau M, Guerrero R. Berlanga M, et al. PLoS One. 2018 Dec 27;13(12):e0209789. doi: 10.1371/journal.pone.0209789. eCollection 2018. PLoS One. 2018. PMID: 30590374 Free PMC article. - Long-term impact of oral vancomycin, ciprofloxacin and metronidazole on the gut microbiota in healthy humans.
Haak BW, Lankelma JM, Hugenholtz F, Belzer C, de Vos WM, Wiersinga WJ. Haak BW, et al. J Antimicrob Chemother. 2019 Mar 1;74(3):782-786. doi: 10.1093/jac/dky471. J Antimicrob Chemother. 2019. PMID: 30418539 - Reproducible community dynamics of the gastrointestinal microbiota following antibiotic perturbation.
Antonopoulos DA, Huse SM, Morrison HG, Schmidt TM, Sogin ML, Young VB. Antonopoulos DA, et al. Infect Immun. 2009 Jun;77(6):2367-75. doi: 10.1128/IAI.01520-08. Epub 2009 Mar 23. Infect Immun. 2009. PMID: 19307217 Free PMC article. - The human microbiome: ecosystem resilience and health.
Relman DA. Relman DA. Nutr Rev. 2012 Aug;70 Suppl 1(Suppl 1):S2-9. doi: 10.1111/j.1753-4887.2012.00489.x. Nutr Rev. 2012. PMID: 22861804 Free PMC article. Review.
Cited by
- An exploratory study of a multi-species probiotic formulation and markers of health in a real-world oncological cohort in the time of covid.
Thomsen M, Vemuri R, Huygens F, Clarke S, Vitetta L. Thomsen M, et al. Inflammopharmacology. 2024 Aug;32(4):2317-2335. doi: 10.1007/s10787-024-01503-1. Epub 2024 Jun 26. Inflammopharmacology. 2024. PMID: 38926298 Free PMC article. - Iron Reshapes the Gut Microbiome and Host Metabolism.
Botta A, Barra NG, Lam NH, Chow S, Pantopoulos K, Schertzer JD, Sweeney G. Botta A, et al. J Lipid Atheroscler. 2021 May;10(2):160-183. doi: 10.12997/jla.2021.10.2.160. Epub 2021 Mar 10. J Lipid Atheroscler. 2021. PMID: 34095010 Free PMC article. Review. - Use of the Microbiome in the Practice of Epidemiology: A Primer on -Omic Technologies.
Foxman B, Martin ET. Foxman B, et al. Am J Epidemiol. 2015 Jul 1;182(1):1-8. doi: 10.1093/aje/kwv102. Epub 2015 May 29. Am J Epidemiol. 2015. PMID: 26025238 Free PMC article. Review. - Epidemiology and associated microbiota changes in deployed military personnel at high risk of traveler's diarrhea.
Walters WA, Reyes F, Soto GM, Reynolds ND, Fraser JA, Aviles R, Tribble DR, Irvin AP, Kelley-Loughnane N, Gutierrez RL, Riddle MS, Ley RE, Goodson MS, Simons MP. Walters WA, et al. PLoS One. 2020 Aug 12;15(8):e0236703. doi: 10.1371/journal.pone.0236703. eCollection 2020. PLoS One. 2020. PMID: 32785284 Free PMC article. - Temporal Stability in Chronic Wound Microbiota Is Associated With Poor Healing.
Loesche M, Gardner SE, Kalan L, Horwinski J, Zheng Q, Hodkinson BP, Tyldsley AS, Franciscus CL, Hillis SL, Mehta S, Margolis DJ, Grice EA. Loesche M, et al. J Invest Dermatol. 2017 Jan;137(1):237-244. doi: 10.1016/j.jid.2016.08.009. Epub 2016 Aug 24. J Invest Dermatol. 2017. PMID: 27566400 Free PMC article.
References
- Ley RE, Peterson DA, Gordon JI. Ecological and evolutionary forces shaping microbial diversity in the human intestine. Cell. 2006;124:837–848. - PubMed
- Salyers AA, Gupta A, Wang Y. Human intestinal bacteria as reservoirs for antibiotic resistance genes. Trends Microbiol. 2004;12:412–416. - PubMed
Publication types
MeSH terms
Substances
LinkOut - more resources
Full Text Sources
Other Literature Sources
Research Materials


