α-Synuclein impairs macroautophagy: implications for Parkinson's disease - PubMed (original) (raw)
. 2010 Sep 20;190(6):1023-37.
doi: 10.1083/jcb.201003122.
Chien-Wen Chen, Silvia Corrochano, Abraham Acevedo-Arozena, David E Gordon, Andrew A Peden, Maike Lichtenberg, Fiona M Menzies, Brinda Ravikumar, Sara Imarisio, Steve Brown, Cahir J O'Kane, David C Rubinsztein
Affiliations
- PMID: 20855506
- PMCID: PMC3101586
- DOI: 10.1083/jcb.201003122
α-Synuclein impairs macroautophagy: implications for Parkinson's disease
Ashley R Winslow et al. J Cell Biol. 2010.
Abstract
Parkinson's disease (PD) is characterized pathologically by intraneuronal inclusions called Lewy bodies, largely comprised of α-synuclein. Multiplication of the α-synuclein gene locus increases α-synuclein expression and causes PD. Thus, overexpression of wild-type α-synuclein is toxic. In this study, we demonstrate that α-synuclein overexpression impairs macroautophagy in mammalian cells and in transgenic mice. Our data show that α-synuclein compromises autophagy via Rab1a inhibition and Rab1a overexpression rescues the autophagy defect caused by α-synuclein. Inhibition of autophagy by α-synuclein overexpression or Rab1a knockdown causes mislocalization of the autophagy protein, Atg9, and decreases omegasome formation. Rab1a, α-synuclein, and Atg9 all regulate formation of the omegasome, which marks autophagosome precursors.
Figures
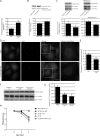
Figure 1.
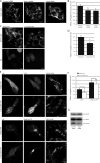
Overexpression of α-synuclein inhibits macroautophagy. (A) Bar graph indicating the effect of α-synuclein–GFP overexpression on HA-tagged httQ74 aggregation in SKNSH, human neuroblastoma cells (odds ratio; n = 9). Note that the number of control cells with httQ74 aggregates can differ under varying experimental setups because of different cell lines, different transfection conditions (e.g., whether httQ74 is transfected along with another expression vector or siRNA), and time. Therefore, the relative change of the experimental condition is important. (B) Effect of α-synuclein overexpression on tomato-tagged p62. Tomato-p62 and DsRed (1.5:1) were transfected for the last 24 h of the experiment at low levels to observe the effect of α-synuclein overexpression on p62. DsRed was used as a transfection control for tomato-p62 (two-tailed Student’s t test; n = 3). (C) Effect of α-synuclein overexpression on LC3-II levels treated with and without bafilomycin A1. Tubulin levels demonstrate equal loading. Densitometry for a representative dataset (n = 3) with and without bafilomycin are shown (two-tailed Student’s t test). (D) Immunostaining of endogenous LC3-positive puncta in SKNSH cells overexpressing α-synuclein–GFP. The boxes in the third column are magnified in column four to show more detail of the differences in autophagosome number at high magnification. Images shown are z-stack projections. Bars, 20 µm. (E) Bar graph indicating the effect of α-synuclein overexpression on LC3 vesicle number (two-tailed Student’s t test; n = 20). (F) LC3-II levels assessed by SDS-PAGE in right hemisphere brain lysates from wild-type mice (+,+) and mice heterozygous (+/M7) and homozygous (M7/M7) for the α-synuclein transgene (M7). Representative samples are shown. (G) Quantification of LC3-II levels from F relative to tubulin by densitometry (one-way ANOVA and Bonferroni post hoc test; n = 3). (A–C, E, and G) Error bars represent SEM (*, P < 0.05; **, P < 0.01; ***, P < 0.001). (H) Neuronal expression of α-synuclein (α-syn; UAS-α-synuclein) using the elav-Gal4 driver (elav-Gal4; elavC155) significantly increased neurodegeneration of flies expressing mutant huntingtin exon-1 (Q120; gmr-Htt(exon1) Q120) in eyes (*, P < 0.02 for comparisons to all controls; paired Student’s t test; n = 5 independent experiments each based on ∼15 ommatidia from each of 10 individuals). Error bars represent SEM.
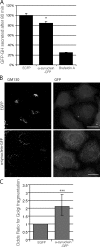
Figure 2.
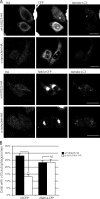
Overexpression of α-synuclein inhibits secretion and causes Golgi fragmentation in mammalian cells. (A) Bar graph indicating the effect of α-synuclein–CFP overexpression on constitutive secretion in a HeLa-derived reporter cell line (C1). Brefeldin A, a known inhibitor of constitutive secretion, was used as a positive control (*, P < 0.05; two-tailed Student’s t test; n = 3). GH, growth hormone. (B) Immunostaining of endogenous GM130 (cis-Golgi marker) in HeLa cells overexpressing α-synuclein–GFP. Images are z-stack projections. Bars, 20 µm. (C) Quantification of α-synuclein effect on Golgi fragmentation (***, P < 0.001; odds ratio; n = 6). (A and C) Error bars represent SEM.
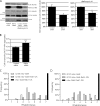
Figure 3.
Knockdown of Rab1a inhibits macroautophagy. (A) LC3-II levels were assessed by SDS-PAGE after knockdown of Rab1a and treatment with bafilomycin A1 in HeLa cells. Actin levels demonstrate equal loading. Densitometry for a representative dataset (n = 3) with and without bafilomycin are shown (*, P < 0.05; Student’s t test). (B) Bar graph indicating the effect of Rab1a knockdown, as in A, on aggregation of httQ74-HA (***, P < 0.001; odds ratio; n = 9). (A and B) Error bars represent SEM. (C) Neuronal expression of constitutively active Rab1 (Rab1-CA; UASp-YFP.Rab1.Q70L) using the elav-Gal4 driver significantly suppressed neurodegeneration of 5-d-old flies expressing mutant huntingtin exon-1 (Q120; 5.0 ± 0.12 and 4.1 ± 0.06 rhabdomeres, in the presence and absence of Rab1-CA, respectively; P ≤ 0.005, by Student’s t test). Each normal fly eye contains hundreds of ommatidia with seven visible rhabdomeres. The graphs show the distributions of the numbers of rhabdomeres per ommatidium for each of the genotypes. Comparisons were performed using the paired Student’s t tests using data from five to seven independent experiments, each based on ∼10 individuals of each genotype, in which 15 ommatidia each were scored. (D) Neuronal expression of dominant-negative Rab1 (Rab1-DN; UAST-YFP.Rab1.S25N) using the elav-Gal4 driver significantly enhanced neurodegeneration of 5-d-old flies expressing mutant huntingtin exon-1 (Q120; 4.1 ± 0.1 and 5.2 ± 0.1 rhabdomeres, in the presence and absence of Rab1-DN, respectively; P < 0.02, by Student’s t test). Note that the different levels of neurodegeneration in the Q120 elav-Gal4 flies between C and D is likely because these were independent experiments, in which the duration was not identical.
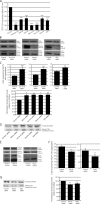
Figure 4.
Autophagy is not dependent on all Rab proteins that regulate secretion. (A) To measure the effect of RNAi of Rab1a, Rab1b, Sar1A/B, Giantin, and VDP on constitutive secretion, HeLa-derived C1 cells were transfected with siRNA corresponding to these genes. The amount of GFP–growth hormone remaining in the cells 80 min after induction of secretion was determined using flow cytometry. As a positive control, the cells were transfected with STX5 (syntaxin5) siRNA, a known inhibitor of secretion (n = 3 independent experiments; ***, P < 0.001; multiple comparisons, one-way ANOVA, Dunnett’s multiple comparisons post hoc test). GH, growth hormone. (B) LC3-II levels were assessed by SDS-PAGE after knockdown of Sar1A and -B, Giantin, or VDP in HeLa cells. Actin levels demonstrate equal loading. (C) Bar graphs indicating the effect of knockdown, as in B, on httQ74 aggregation (**, P< 0.01; ***, P < 0.001; odds ratio; n = 9). (D) Tomato-p62 and DsRed were transfected into HeLa cells during the last 24 h of knockdown, as in B, and the effects were measured by SDS-PAGE. DsRed was used as a transfection control for tomato-p62. Quantification of tomato-p62 levels relative to DsRed is shown in the bar graph (*, P < 0.05; **, P < 0.01; Dunnett’s multiple comparison post hoc test; n = 3). Values were normalized to control values for separate experiments. (E) LC3-II levels were assessed by SDS-PAGE after knockdown of Rab1b (bands shown are from the same gel, and unrelated lanes have been omitted) or Rab2. Actin and tubulin levels demonstrate equal loading. (F) Bar graphs indicating the effect of knockdown, as in E, on the percentage of httQ74 aggregation in transfected cells (***, P < 0.001; odds ratio; n = 9). (G) Tomato-p62 and DsRed were transfected into HeLa cells during the last 24 h of knockdown, as in E, and the effects were measured by SDS-PAGE. DsRed was used as a transfection control for tomato-p62. Quantification of tomato-p62 levels relative to DsRed is shown in the bar graph (**, P < 0.01; Bonferroni’s multiple comparison post hoc test; n = 3). Values were normalized to control values for separate experiments. (A, C, D, F, and G) Error bars represent SEM.
Figure 5.
Rab1a can rescue the effect of α-synuclein on macroautophagy. (A) The effect of cells expressing α-synuclein–HA with empty CFP vector (control conditions) or Rab1a-CFP (rescue conditions) on tomato-LC3 vesicles in SKNSH cells. HA-tagged wild-type (wt) huntingtin exon-1 fragment with 23 polyglutamine repeats (httQ23) was used as a control for cells expressing α-synuclein–HA in both control and rescue conditions. We have used a cut-off of 20 vesicles per cell in these experiments because the transient transfection of LC3 increases the baseline levels of vesicles (compared with endogenous LC3), and 20 vesicles is the mean observed under wild-type conditions in these cells. Bars, 20 µm. (B) Quantification of the effect of Rab1a-CFP on α-synuclein–dependent reduction of LC3 levels (**, P < 0.01; two-tailed Student’s t test; n = 3). Error bars represent SEM.
Figure 6.
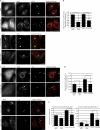
α-Synuclein and Rab1a affect the colocalization of Atg9 and LC3 vesicles. (A) Endogenous immunostaining of Atg9 and p230 in SKNSH cells with α-synuclein overexpression or Rab1a knockdown. Empty GFP vector (EGFP) was used as a control for cells expressing α-synuclein–GFP. Images shown are z-stack projections. The Atg9 panels show a clear dispersal of the perinuclear localization with α-synuclein overexpression or Rab1a knockdown. Golgi fragmentation can be seen in the p230 columns. α-Synuclein overexpression causes an increase in the disorganization of the Golgi structure, a phenotype which is amplified with Rab1a knockdown. (Magnifications of these images have been deposited in the JCB DataViewer.) (B) Quantification of Atg9 colocalization with p230 (Pearson’s coefficient; ***, P < 0.001; two-tailed Student’s t test; n = 10 from one representative experiment). (C) Immunostaining of endogenous Atg9 and LC3 in cells with α-synuclein overexpression or Rab1a knockdown. Empty GFP vector (GFP) was used as a control for cells expressing α-synuclein–GFP. Colocalization is highlighted in white on merged panel (image generated by ImageJ Colocalization plugin). Images are single confocal planes to more precisely determine colocalization. Arrows denote colocalization events. (Magnifications of these images have been deposited in the JCB DataViewer.) (D and E) Quantification of Atg9 colocalization with LC3 (Pearson’s [D] and Mander’s coefficient [E]). The Mander’s coefficient shown in the first bar graph in E more accurately predicts Atg9/LC3 colocalization when LC3 vesicle number is reduced by Rab1a knockdown or α-synuclein overexpression (*, P < 0.05; **, P < 0.01; ***, P < 0.001; two-tailed Student’s t test; n = 10). (B, D, and E) Error bars represent SEM. See related
Fig. S3
. Bars: (A) 20 µm; (C) 10 µm.
Figure 7.
α-Synuclein, Rab1a, and Atg9 affect omegasome and autophagosome formation. (A) The effect of Rab1a and Atg9 knockdown on omegasome formation in DFCP1-GFP HEK293, human embryonic kidney cells. (B) Quantification of A (*, P < 0.05; one-way ANOVA, Dunnett’s multiple comparison post hoc test; n = 10). (C) The effect of α-synuclein on omegasome formation in DFCP1-GFP HEK293 cells. httQ23-HA was used as a control for cells expressing α-synuclein–HA. (A and C) Arrows mark omegasomes. Images shown are single-plane images. (D) Quantification of C (*, P < 0.05; two-tailed Student’s t test; n = 10). (E) The effect of cells expressing α-synuclein–HA with empty CFP vector (control conditions) or Rab1a-CFP (rescue conditions) on omegasome formation. HA-tagged wild-type huntingtin exon-1 fragment with 23 polyglutamine repeats (httQ23) was used as a control for cells expressing α-synuclein–HA in both control and rescue conditions. Z-stack projections are shown. Arrows denote omegasomes. (F) Quantification of E (*, P < 0.05; two-tailed Student’s t test; n = 10). (B, D, and F) Error bars represent SEM. (G) Effect of Atg9 knockdown on LC3-II levels in SKNSH cell lysates. Actin was used to demonstrate equal loading. Bars: (A and C) 20 µm; (E) 10 µm.
Figure 8.
Cumulative molecular effects of α-synuclein overexpression. Diagram illustrating the pleiotropic effects of increased intracellular levels of α-synuclein on vital intracellular pathways. The effects of α-synuclein on macroautophagy would likely cause increased susceptibility to proapoptotic insults, mitochondrial dysfunction, and increased aggregation, which are all features of PD.
Similar articles
- The Parkinson disease protein α-synuclein inhibits autophagy.
Winslow AR, Rubinsztein DC. Winslow AR, et al. Autophagy. 2011 Apr;7(4):429-31. doi: 10.4161/auto.7.4.14393. Epub 2011 Apr 1. Autophagy. 2011. PMID: 21157184 Free PMC article. Review. - Rab1A over-expression prevents Golgi apparatus fragmentation and partially corrects motor deficits in an alpha-synuclein based rat model of Parkinson's disease.
Coune PG, Bensadoun JC, Aebischer P, Schneider BL. Coune PG, et al. J Parkinsons Dis. 2011;1(4):373-87. doi: 10.3233/JPD-2011-11058. J Parkinsons Dis. 2011. PMID: 23939344 - α-Synuclein impairs ferritinophagy in the retinal pigment epithelium: Implications for retinal iron dyshomeostasis in Parkinson's disease.
Baksi S, Singh N. Baksi S, et al. Sci Rep. 2017 Oct 9;7(1):12843. doi: 10.1038/s41598-017-12862-x. Sci Rep. 2017. PMID: 28993630 Free PMC article. - α-Synuclein levels affect autophagosome numbers in vivo and modulate Huntington disease pathology.
Corrochano S, Renna M, Tomas-Zapico C, Brown SD, Lucas JJ, Rubinsztein DC, Acevedo-Arozena A. Corrochano S, et al. Autophagy. 2012 Mar;8(3):431-2. doi: 10.4161/auto.19259. Epub 2012 Feb 24. Autophagy. 2012. PMID: 22361581 - Ubiquitination of alpha-synuclein and autophagy in Parkinson's disease.
Engelender S. Engelender S. Autophagy. 2008 Apr;4(3):372-4. doi: 10.4161/auto.5604. Epub 2008 Jan 18. Autophagy. 2008. PMID: 18216494 Review.
Cited by
- Research progress of T cell autophagy in autoimmune diseases.
Zhao X, Ma D, Yang B, Wang Y, Zhang L. Zhao X, et al. Front Immunol. 2024 Jul 22;15:1425443. doi: 10.3389/fimmu.2024.1425443. eCollection 2024. Front Immunol. 2024. PMID: 39104538 Free PMC article. Review. - Dopamine oxidation and autophagy.
Muñoz P, Huenchuguala S, Paris I, Segura-Aguilar J. Muñoz P, et al. Parkinsons Dis. 2012;2012:920953. doi: 10.1155/2012/920953. Epub 2012 Aug 26. Parkinsons Dis. 2012. PMID: 22966478 Free PMC article. - Proteostasis Disturbances and Inflammation in Neurodegenerative Diseases.
Sonninen TM, Goldsteins G, Laham-Karam N, Koistinaho J, Lehtonen Š. Sonninen TM, et al. Cells. 2020 Sep 28;9(10):2183. doi: 10.3390/cells9102183. Cells. 2020. PMID: 32998318 Free PMC article. Review. - The puzzling origin of the autophagosomal membrane.
Mari M, Tooze SA, Reggiori F. Mari M, et al. F1000 Biol Rep. 2011;3:25. doi: 10.3410/B3-25. Epub 2011 Dec 1. F1000 Biol Rep. 2011. PMID: 22162728 Free PMC article. - Role of α-synuclein in inducing innate and adaptive immunity in Parkinson disease.
Allen Reish HE, Standaert DG. Allen Reish HE, et al. J Parkinsons Dis. 2015;5(1):1-19. doi: 10.3233/JPD-140491. J Parkinsons Dis. 2015. PMID: 25588354 Free PMC article. Review.
References
- Axe E.L., Walker S.A., Manifava M., Chandra P., Roderick H.L., Habermann A., Griffiths G., Ktistakis N.T. 2008. Autophagosome formation from membrane compartments enriched in phosphatidylinositol 3-phosphate and dynamically connected to the endoplasmic reticulum. J. Cell Biol. 182:685–701 10.1083/jcb.200803137 - DOI - PMC - PubMed
Publication types
MeSH terms
Substances
Grants and funding
- MC_U142684175/MRC_/Medical Research Council/United Kingdom
- 089703/WT_/Wellcome Trust/United Kingdom
- MC_G1000734/MRC_/Medical Research Council/United Kingdom
- MC_U142684172/MRC_/Medical Research Council/United Kingdom
- G0600194/MRC_/Medical Research Council/United Kingdom
- WT_/Wellcome Trust/United Kingdom
LinkOut - more resources
Full Text Sources
Other Literature Sources
Medical
Molecular Biology Databases
