Broca's region: novel organizational principles and multiple receptor mapping - PubMed (original) (raw)
Broca's region: novel organizational principles and multiple receptor mapping
Katrin Amunts et al. PLoS Biol. 2010.
Abstract
There is a considerable contrast between the various functions assigned to Broca's region and its relatively simple subdivision into two cytoarchitectonic areas (44 and 45). Since the regional distribution of transmitter receptors in the cerebral cortex has been proven a powerful indicator of functional diversity, the subdivision of Broca's region was analyzed here using a multireceptor approach. The distribution patterns of six receptor types using in vitro receptor autoradiography revealed previously unknown areas: a ventral precentral transitional cortex 6r1, dorsal and ventral areas 44d and 44v, anterior and posterior areas 45a and 45p, and areas op8 and op9 in the frontal operculum. A significant lateralization of receptors was demonstrated with respect to the cholinergic M(2) receptor, particularly in area 44v+d. We propose a new concept of the anterior language region, which elucidates the relation between premotor cortex, prefrontal cortex, and Broca's region. It offers human brain homologues to the recently described subdivision of area 45, and the segregation of the ventral premotor cortex in macaque brains. The results provide a novel structural basis of the organization of language regions in the brain.
Conflict of interest statement
The authors have declared that no competing interests exist.
Figures
Figure 1. Cytoarchitectonic map of the lateral surface of a human cortex adapted from Brodmann .
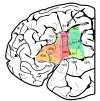
The region of interest contains areas 44 and 45 as well as parts of the neighboring areas 4, 6, and 47. Note that Brodmann's map does not show the ventral border of area 44, 45, and 6 in the depth of the lateral fissure. ab, ascending branch of the lateral fissure; cs, central sulcus; hb, horizontal branch of the lateral fissure; ifs, inferior frontal sulcus; lf, lateral fissure; prcs, precentral sulcus.
Figure 2. Photomicrographs of cell body–stained cryostat sections of areas op8 (a), op9 (b), and 6r1 (c).
The frontal opercular areas op8 and op9 are both dysgranular (i.e., thin lamina IV). The cell packing density was slightly larger in area op8 than in area op9. Area 6r1 has an even thinner layer IV; it is almost agranular. Its laminar pattern is weak. In contrast to ventral area 6 and Broca's area 44 it contains smaller pyramidal cells in lamina III. Scale bar, 0.5 mm. Roman numerals indicate the cortical layers.
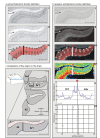
Figure 3. Algorithm-based detection of borders in human brain sections.
(a) Cytoarchitectonic border definition: cytoarchitecture (I), corresponding GLI image (II), and traverses covering the cortical ROI (III, numbered red lines). The position of the border (bold line) is superimposed onto the GLI image. GLI is an indicator of the volume fraction of cell bodies . (b) Border definition in the receptor autoradiograph: receptor autoradiograph showing the distribution of glutamatergic kainate receptors (I), linearized image (II), traverses including the position of the detected border (bold line) superimposed on the linearized image (III), color-coded receptor autoradiograph (here and in the following graphs the color scale indicates to the concentration of the receptor in fmol/mg protein (IV), Mahalanobis distance function for a block size of n = 14 profiles (V), localization of significant peaks in the Mahalanobis distance function in dependence on the block size (p<0.05; VI). The Mahalanobis distance was measured between blocks of profiles (ten to 20 profiles). The border at profile number 59 (asterisk) was reproduced for different block sizes. (c) Scheme of a horizontal section through the posterior inferior-frontal human cortex including the border between areas 44v and 6r1. Scale bar, 5 mm. ab, ascending branch of the lateral fissure; cs, central sulcus; ifs, inferior frontal sulcus; lf, lateral fissure; prcs, precentral sulcus.
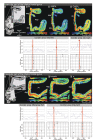
Figure 4. Receptor architecture the inferior frontal gyrus in coronal sections.
(a, e) location of the opercular (Pop) and triangular parts (Pt) in the coronal sections. The border between areas 44 and op8 is characterized by a decrease in receptor density of AMPA and GABAA receptors mainly in the more superficial layers, and a decrease of M2 receptor density both in more superficial and deeper cortical layers (b–d). The receptor distribution of cholinergic M2, glutamatergic kainite, and noradrenergic α1 receptors in the triangular part is shown in (f–h). The ventral border of area 45 with area op9 was discernible by a decrease in kainate and M2 receptor densities and an increase in α1 receptors. For each receptor, the Mahalanobis distance function is shown for a block size of n = 15 profiles together with a graph showing the dependency of the location of maxima on the block size. Red asterisk indicates the significant maximum of the Mahalanobis distance function. The areal border is indicated by a consistent occurrence of significant maxima (red frame). White dotted lines indicate the receptor architectonic subdivision of area 44 into a dorsal (d) and a ventral (v) part. Cis, circular insular sulcus; ifs, inferior frontal sulcus; sfs, superior frontal sulcus; lf, lateral fissure.
Figure 5. Receptor distributions of the cholinergic M1, and the glutamatergic kainate and AMPA receptors in a horizontal section.
The border between areas 44 and 45 is characterized by a decrease in densities of M1 and AMPA receptors in the more superficial layers in area 45 as compared to 44, and an increase of kainate receptor density in 45. A subdivision of area 45 is indicated, dividing it into an anterior (a) and a posterior (p) part. This subdivision is indicated by differences between both areas in M1 and AMPA receptor densities in the more superficial layers. The graphs below show the Mahalanobis distance functions (block size of n = 14 profiles) together with the dependency of the location of main maxima on the block size for the border between areas 45a and 45p (M1 and kainate receptors), as well as for the border between areas 44 and 45p (AMPA receptor). Designation as above. Dotted white lines indicate the receptor architectonic subdivision of area 45. ab, ascending branch of the lateral fissure; cs, central sulcus; prcs, precentral sulcus; tr, triangular part of the inferior frontal gyrus.
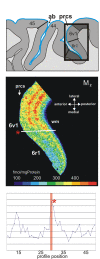
Figure 6. Receptor architectonic borders of area 6r1 with area 6v1 based on cholinergic M2-receptor distribution.
Demonstration of the border (*) in a horizontal section of the posterior wall of the precentral sulcus and location of the ROI. The border between area 6v1 and area 6r1 is characterized by a decrease of M2 receptor density. prcs, precentral sulcus; wm, white matter. The graphs demonstrate quantification of borders. Designation as above.
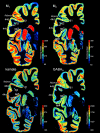
Figure 7. Receptor mapping in whole hemispheric human brain sections.
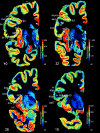
Distribution of the cholinergic muscarinic M1 and M2 receptors, the glutamatergic kainite, and GABA-ergic GABAA receptors in a neighboring coronal sections of a complete human hemisphere (level 32). The receptor concentrations are indicated in fmol/mg protein and color coded according to the color bar on the right of each section. Designation as above.
Figure 8. Topographical relationship of receptorarchitectonic areas in a series of four coronal sections (noradrenergic α1 receptor, from caudal to rostral at levels 40, 32, 26, and 19.
The receptor concentrations are indicated in fmol/mg protein and color coded according to the color bar on the right of each section. Designation as above.
Figure 9. Extent of delineated areas projected to the lateral surface of an individual postmortem brain.
Same hemisphere as shown in Figure 7.
Figure 10. Hierarchical cluster analysis of the posterior inferior-frontal areas based on quantitative receptor architectonic data.
Euclidean distances were calculated as a multivariate measure for interareal differences. A small Euclidean distance between areas, e.g., between areas 44 and 45 or areas op8 and op9, indicates a high similarity in their receptor architectonic organization. The graph shows that areas 47 and 4 differ maximally from the group of areas. Areas 44 and 45 were not divided in 44d and 44v, or 45a and 45p, because all these areas were not present in all brains studied here.
Figure 11. Interhemispheric differences in the concentration of receptor binding sites of the muscarinic M2 receptor per area.
This receptor type differed significantly between left and right hemispheres with higher values on the left than on the right (p<0.05). Means in fmol/mg protein and standard errors of arithmetic means.
Similar articles
- Distinct parietal and temporal pathways to the homologues of Broca's area in the monkey.
Petrides M, Pandya DN. Petrides M, et al. PLoS Biol. 2009 Aug;7(8):e1000170. doi: 10.1371/journal.pbio.1000170. Epub 2009 Aug 11. PLoS Biol. 2009. PMID: 19668354 Free PMC article. - Architecture and organizational principles of Broca's region.
Amunts K, Zilles K. Amunts K, et al. Trends Cogn Sci. 2012 Aug;16(8):418-26. doi: 10.1016/j.tics.2012.06.005. Epub 2012 Jul 3. Trends Cogn Sci. 2012. PMID: 22763211 Review. - A comparative magnetic resonance imaging study of the anatomy, variability, and asymmetry of Broca's area in the human and chimpanzee brain.
Keller SS, Roberts N, Hopkins W. Keller SS, et al. J Neurosci. 2009 Nov 18;29(46):14607-16. doi: 10.1523/JNEUROSCI.2892-09.2009. J Neurosci. 2009. PMID: 19923293 Free PMC article. - Adult structure and development of the human fronto-opercular cerebral cortex (Broca's region).
Judas M, Cepanec M. Judas M, et al. Clin Linguist Phon. 2007 Nov-Dec;21(11-12):975-89. doi: 10.1080/02699200701617175. Clin Linguist Phon. 2007. PMID: 17972193 - Dynamic anticipatory processing of hierarchical sequential events: a common role for Broca's area and ventral premotor cortex across domains?
Fiebach CJ, Schubotz RI. Fiebach CJ, et al. Cortex. 2006 May;42(4):499-502. doi: 10.1016/s0010-9452(08)70386-1. Cortex. 2006. PMID: 16881258 Review.
Cited by
- Dissociating frontal regions that co-lateralize with different ventral occipitotemporal regions during word processing.
Seghier ML, Price CJ. Seghier ML, et al. Brain Lang. 2013 Aug;126(2):133-40. doi: 10.1016/j.bandl.2013.04.003. Epub 2013 May 29. Brain Lang. 2013. PMID: 23728081 Free PMC article. - The Human Brainnetome Atlas: A New Brain Atlas Based on Connectional Architecture.
Fan L, Li H, Zhuo J, Zhang Y, Wang J, Chen L, Yang Z, Chu C, Xie S, Laird AR, Fox PT, Eickhoff SB, Yu C, Jiang T. Fan L, et al. Cereb Cortex. 2016 Aug;26(8):3508-26. doi: 10.1093/cercor/bhw157. Epub 2016 May 26. Cereb Cortex. 2016. PMID: 27230218 Free PMC article. - Postoperative expressive aphasia associated with intravenous midazolam administration: a 5-year retrospective case-control study.
Oh S, Chung J, Baek S, Park YJ. Oh S, et al. J Int Med Res. 2020 Aug;48(8):300060520948751. doi: 10.1177/0300060520948751. J Int Med Res. 2020. PMID: 32851907 Free PMC article. - Dissecting structural connectivity of the left and right inferior frontal cortex in children who stutter.
Neef NE, Angstadt M, Koenraads SPC, Chang SE. Neef NE, et al. Cereb Cortex. 2023 Mar 21;33(7):4085-4100. doi: 10.1093/cercor/bhac328. Cereb Cortex. 2023. PMID: 36057839 Free PMC article. - Hierarchical syntactic processing is beyond mere associating: Functional magnetic resonance imaging evidence from a novel artificial grammar.
Chen L, Goucha T, Männel C, Friederici AD, Zaccarella E. Chen L, et al. Hum Brain Mapp. 2021 Jul;42(10):3253-3268. doi: 10.1002/hbm.25432. Epub 2021 Apr 6. Hum Brain Mapp. 2021. PMID: 33822433 Free PMC article.
References
- Broca P. Remarques sur le siége de la faculté du langage articulé, suivies d'une observation d'aphemie (perte de la parole). [Comments regarding the seat of the faculty of spoken language, followed by an observation of aphemia (loss of speech). Grodzinsky Y, Amunts K, translators. Broca's region. Oxford, New York: Oxford University Press. pp. 291–304]. Bull Mem Soc Anat Paris. 1861;36:330–357.
- Caplan D, Hidebrandt N, Makris N. Location of lesions in stroke patients with deficits in syntactic processing in sentence comprehension. Brain. 1996;119:933–949. - PubMed
- Alexander M. P, Naeser M. A, Palumbo C. Broca's area aphasias: aphasia after lesions including the frontal operculum. Neurology. 1990;40:353–362. - PubMed
- Mohr J. P, Pessin M. S, Finkelstein S, Funkenstein H. H, Duncan G. W, et al. Broca aphasia: pathologic and clinical. Neurology. 1978;28:311–324. - PubMed
- Brodmann K. Leipzig: Barth JA; 1909. Vergleichende Lokalisationslehre der Groβhirnrinde in ihren Prinzipien dargestellt auf Grund des Zellenbaues.
Publication types
MeSH terms
Substances
LinkOut - more resources
Full Text Sources
Other Literature Sources


