Microglia shape adult hippocampal neurogenesis through apoptosis-coupled phagocytosis - PubMed (original) (raw)
Microglia shape adult hippocampal neurogenesis through apoptosis-coupled phagocytosis
Amanda Sierra et al. Cell Stem Cell. 2010.
Abstract
In the adult hippocampus, neuroprogenitor cells in the subgranular zone (SGZ) of the dentate gyrus give rise to newborn neuroblasts. However, only a small subset of these cells integrates into the hippocampal circuitry as mature neurons at the end of a 4 week period. Here, we show that the majority of the newborn cells undergo death by apoptosis in the first 1 to 4 days of their life, during the transition from amplifying neuroprogenitors to neuroblasts. These apoptotic newborn cells are rapidly cleared out through phagocytosis by unchallenged microglia present in the adult SGZ niche. Phagocytosis by the microglia is efficient and undeterred by increased age or inflammatory challenge. Our results suggest that the main critical period of newborn cell survival occurs within a few days of birth and reveal a new role for microglia in maintaining the homeostasis of the baseline neurogenic cascade.
Copyright © 2010 Elsevier Inc. All rights reserved.
Figures
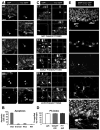
Figure 1. Apoptosis is coupled to phagocytosis in the young adult SGZ
(A) Confocal photomicrographs of apoptotic cells in the young adult (1m.o.) SGZ. Apoptotic cells (arrowheads), detected by pyknosis/karyorrhexis (condensed DAPI staining) and act-casp3, are predominantly located in the SGZ (A1), and more sparsely in the granular cell layer (A2) and hilus (A3). Apoptotic cells in A1 and A2 are engulfed by microglia visualized in fms-EGFP mice. (B) Quantification of the location of apoptotic cells, identified by pyknosis and act-casp3 expression, in the hippocampus. The vast majority of apoptotic cells is located strictly in the SGZ. (C) Different stages of phagocytosis in the SGZ. The microglial engulfment of apoptotic cells (pyknotic, act-casp3 immunopositive) was assessed in orthogonal projections of confocal z-stacks. Apoptotic cells are either not phagocytosed (C1); undergoing early phagocytosis (loose microglial pouch, conspicuous act-casp3 immunolabeling; C2); or late phagocytosis (tight microglial pouch, dim act-casp3 immunolabeling; C3). (D) Quantification of the phagocytic index (Ph-index), i.e., the percentage of SGZ apoptotic cells that are engulfed by microglia (early and late phagocytosis together), in three independent experiments. A large percentage (> 90%) of the apoptotic cells is completely engulfed by microglia. (E) Confocal photomicrographs of the SGZ showing Iba+ microglial processes and somas intermingled with the SGZ NPCs (nestin-GFP+) and NBs (PSA-NCAM+). DAPI staining indicates cell nuclei. The arrowhead points to an apoptotic (pyknotic) cell, identified by condensed DAPI staining, that expresses PSA-NCAM and is engulfed by the microglial process. Scale bars: A, C, 10μm; E, 20μm; See also Fig. S1. Bars represent mean ± SEM
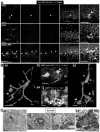
Figure 2. Unchallenged microglia phagocytose a_poptotic cells in the normal adult SGZ_
(A) Confocal photomicrographs of the expression of CD11b and CD68 in phagocytic microglia. Phagocytic SGZ and non-phagocytic CA2 microglia express low levels of CD11b and CD68, while LPS-challenged microglia express high levels of these markers (n=3 fms-EGFP mice; LPS 5mg/kg, 24h). The expression of fms-EGFP is similar in all experimental groups studied. Identical confocal settings were used to collect images from all animals. Enlarged insets of the merged images are shown at the end of each row. See also Fig. S2. (B) Phagocytosis by microglia involves a ball-and-chain structure, formed by microglial en passant or terminal branches clearly distinguishable from the microglial cell body (M), as shown in volume rendering images of confocal z-stacks. The microglial phagocytic pouch in B1 (arrowhead) is shown in detail in B2: a pyknotic nucleus located on top of a PSA-NCAM+ NB and nearby nestin-GFP+ NPC is undergoing phagocytosis. The right microglial phagocytic pouch in B3 (arrowhead) is shown in detail in B4: a pyknotic nucleus located amongst immature and mature neurons (labeled with Prox1 and NeuN, respectively) is undergoing phagocytosis. (C) Electron micrographs of the apoptotic cells and phagocytosis by microglia in the young adult SGZ. C1, Microglia (M), detected by Iba1-DAB immunostaining, is intermingled among the SGZ cells; C2, apoptotic cell (Pyk), identified by nuclear morphology, is engulfed by microglia (M); C3, terminal apoptotic debris is engulfed by microglia (M). C4, enlarged region of interest from C3. Scale bars: A, 20μm (z=10μm); B, 10μm; C1-C3, 5μm; C4, 500nm. Arrowheads, phagocytic pouches; M, microglia; h, hilus; Pyk, pyknotic body; As, astrocyte.
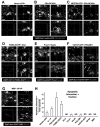
Figure 3. Cell identity of the SGZ apoptotic cells
Confocal orthogonal projections of apoptotic cells, identified by pyknosis/karyorrhexis, express different cell-type specific biomarkers in the young adult neurogenic SGZ. Low magnification images of all immunolabeling data can be found in Fig. S3. (A) Apoptotic cell expressing nestin-GFP. (B) Apoptotic cell expressing PSA-NCAM. (C) Apoptotic cell expressing nestin-GFP and PSA-NCAM. (D) Apoptotic cell expressing POMC-EGFP but not DCX. (E) Apoptotic cell expressing Prox1 but not NeuN. (F) Apoptotic cell expressing PECAM1 but not hGFAP-GFP. A capillary with PECAM1+ endothelial cell surrounded by hGFAP-GFP+ astrocytic terminal feet is nearby (arrows). (G) Apoptotic cell not expressing either MBP or GFAP. (H) Fraction of SGZ apoptotic cells expressing each of the different cell-type markers shown above. The majority of the apoptotic cells expresses markers of cells found in early stages of the neurogenic cascade. Scale bars: 10μm. ND, non-detectable. Bars represent mean ± SEM. Arrows, capillary.
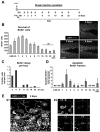
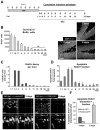
Figure 4. Survival of newborn cells in a single BrdU injection paradigm
(A) Experimental design showing a single injection of BrdU at t=0 and the different time points studied thereafter (SAC = sacrifice time points). (B) Left panel: quantification of the number of BrdU+ cells along the time course of 32 days post-injection (dpi). Statistical differences were assessed by ANOVA (p<0.001) followed by Least Significant Difference (LSD) tests comparing each time point with all later time points. The maximum number is reached at 2 dpi and decreases afterwards. Starting from 15 dpi, no significant differences are found with any of the later time points (ns). Right panel: Photomicrographs of the 1 m.o. mouse sections of the dentate gyrus at 2, 3 and 4 dpi depict the decrease in the number of BrdU+ cells in the SGZ. (C) BrdU decay, quantified as percentage of the cells at 2 dpi lost per hour. (D) Apoptotic BrdU+ fraction, quantified as the percentage of apoptotic cells labeled with BrdU along the time course of 32 dpi. Apoptotic BrdU+ cells are mostly found between 1 and 3 dpi. (E) Confocal photomicrograph of an apoptotic (pyknotic) cell labeled with BrdU at 2 dpi (arrowhead) and phagocytosed by microglia (M), shown as a three-dimensional rendering (E1) and in orthogonal projections of confocal z-stacks (E2). (Same cell is shown in Fig. S1E). Scale bars: B, 50μm (z=20μm); E1, E2, 10μm. ND, non-detectable. Bars represent mean ± SEM.
Figure 5. Survival of newborn cells in a cumulative BrdU injection paradigm
(A) Experimental design showing the injection of BrdU every 3h for 24h and the different time points studied after the first injection (SAC = sacrifice time points). (B) Left panel: quantification of the number of BrdU+ cells along the time course of 32 days post-injection (dpi). Statistical differences were assessed by ANOVA (p<0.001) followed by LSD tests comparing each time point with all later time points. Starting from 11dpi, no significant differences are found with any of the later time points (ns). Right panel: Photomicrographs of the 1 m.o. mouse sections of the dentate gyrus at 2, 4 and 6 dpi depict larger number of BrdU+ cells labeled with the cumulative BrdU paradigm compared to the single BrdU paradigm, but still decreasing in number over time. (C) BrdU decay, quantified as percentage of the cells at 2 dpi lost per hour. (D) Apoptotic BrdU+ fraction, quantified as the percentage of apoptotic cells labeled with BrdU along the time course of 32 dpi. Apoptotic BrdU+ cells peak between 2 and 4dpi. (E) Confocal photomicrographs of the nestin-GFP and POMC-EGFP expression in the early (3dpi) and late (8dpi) critical periods, respectively. (F) Quantification of the biomarker expression in the early (3dpi) and late (8dpi) critical periods. In the early critical period, apoptotic cells express nestin-GFP and POMC-EGFP, whereas only POMC-EGFP is expressed in the late critical period. Scale bars: B, 50μm (z=20μm); E, 10μm. ND, non-detectable. Bars represent mean ± SEM. See also Fig. S4.
Figure 6. Age-dependent decline in SGZ apoptosis
(A) Photomicrographs of the hippocampal sections obtained from 1, 2, 5, and 12 m.o. mouse demonstrate the decline in the number of NBs (PSA-NCAM+) and the number of apoptotic profiles, identified by nuclear morphology (pyknosis) and phagocytosis by microglia (Iba1+), pointed by arrows. Numbered insights represent higher magnification of the identified apoptotic cells. (B) Quantification of the number of apoptotic cells in the SGZ during adulthood. The number of SGZ apoptotic cells decreases sharply after 1 month of age. (C) Quantification of the Ph-index. The microglial phagocytic efficiency remains constant throughout adulthood. Scale bars; low magnification, 50μm (z=16.24μm); high magnification, 10μm. Bars represent mean ± SEM.
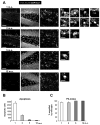
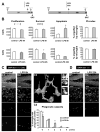
Figure 7. Acute inflammation affects young adult SGZ neurogenesis and apoptosis
(A) Experimental paradigm for the study of the effects of LPS (1mg/kg), 8h or 22h, on the neurogenic cascade. To study the LPS effect on newborn cell survival, IdU was injected 2 days before LPS. To study the LPS effect on cell proliferation, CldU was injected 2 hr before the end of the experiment (SAC = sacrifice time points). (B) Quantification of the effects of LPS 8h (upper panels) or 22h (lower panels) after treatment, on the NPC proliferation (CldU+ cells), newborn cell survival (IdU+ cells), apoptosis (pyknosis), and Ph-index. SGZ apoptosis increases 8h after LPS and is followed by a decreased survival 22h after LPS. Proliferation and Ph-index remain unaffected. (C) Representative examples of the proliferation, survival, apoptosis and phagocytosis in the young adult mouse SGZ in control and LPS-treated animals at 8h (C1, C2). A 3D rendering of a microglial cell (8h after LPS) phagocytosing three apoptotic cells is shown in C3. The phagocytic capacity (percentage of microglia with 0–4 phagocytic profiles) is increased 8h after LPS treatment (C4). (D) Representative examples of the proliferation, apoptosis and phagocytosis in the young adult mouse SGZ in control and LPS-treated animals at 22 hours (D1, D2). See also Fig. S5. Scale bars: C1, C2, 50μm (z=20μm); C3, 5μm; D1, 2, 50μm (z=20μm). Ph1-3, phagocytic processes. Bars represent mean ± SEM.*, p<0.05 (Student t-test).
Comment in
- Waste management and adult neurogenesis.
Mattocks M, Tropepe V. Mattocks M, et al. Cell Stem Cell. 2010 Oct 8;7(4):421-2. doi: 10.1016/j.stem.2010.09.008. Cell Stem Cell. 2010. PMID: 20887944
Similar articles
- Microglia engulf viable newborn cells in the epileptic dentate gyrus.
Luo C, Koyama R, Ikegaya Y. Luo C, et al. Glia. 2016 Sep;64(9):1508-17. doi: 10.1002/glia.23018. Epub 2016 Jun 15. Glia. 2016. PMID: 27301702 - Microglia Actively Remodel Adult Hippocampal Neurogenesis through the Phagocytosis Secretome.
Diaz-Aparicio I, Paris I, Sierra-Torre V, Plaza-Zabala A, Rodríguez-Iglesias N, Márquez-Ropero M, Beccari S, Huguet P, Abiega O, Alberdi E, Matute C, Bernales I, Schulz A, Otrokocsi L, Sperlagh B, Happonen KE, Lemke G, Maletic-Savatic M, Valero J, Sierra A. Diaz-Aparicio I, et al. J Neurosci. 2020 Feb 12;40(7):1453-1482. doi: 10.1523/JNEUROSCI.0993-19.2019. Epub 2020 Jan 2. J Neurosci. 2020. PMID: 31896673 Free PMC article. - A simulation model of neuroprogenitor proliferation dynamics predicts age-related loss of hippocampal neurogenesis but not astrogenesis.
Beccari S, Valero J, Maletic-Savatic M, Sierra A. Beccari S, et al. Sci Rep. 2017 Nov 28;7(1):16528. doi: 10.1038/s41598-017-16466-3. Sci Rep. 2017. PMID: 29184142 Free PMC article. - Adult neurogenesis in the mammalian dentate gyrus.
Abbott LC, Nigussie F. Abbott LC, et al. Anat Histol Embryol. 2020 Jan;49(1):3-16. doi: 10.1111/ahe.12496. Epub 2019 Sep 30. Anat Histol Embryol. 2020. PMID: 31568602 Review. - Age-dependent decline in neurogenesis of the hippocampus and extracellular nucleotides.
Takei Y. Takei Y. Hum Cell. 2019 Apr;32(2):88-94. doi: 10.1007/s13577-019-00241-9. Epub 2019 Feb 7. Hum Cell. 2019. PMID: 30730038 Review.
Cited by
- Can exercise benefits be harnessed with drugs? A new way to combat neurodegenerative diseases by boosting neurogenesis.
Zhao R. Zhao R. Transl Neurodegener. 2024 Jul 25;13(1):36. doi: 10.1186/s40035-024-00428-7. Transl Neurodegener. 2024. PMID: 39049102 Free PMC article. Review. - Microglia through MFG-E8 signaling decrease the density of degenerating neurons and protect the brain from the development of cortical infarction after stroke.
Wang EY, Chen HS, Wu MC, Yang YL, Wang HL, Liu CW, Lai TW. Wang EY, et al. PLoS One. 2024 Aug 7;19(8):e0308464. doi: 10.1371/journal.pone.0308464. eCollection 2024. PLoS One. 2024. PMID: 39110702 Free PMC article. - The effects of microglia- and astrocyte-derived factors on neurogenesis in health and disease.
Araki T, Ikegaya Y, Koyama R. Araki T, et al. Eur J Neurosci. 2021 Sep;54(5):5880-5901. doi: 10.1111/ejn.14969. Epub 2020 Sep 21. Eur J Neurosci. 2021. PMID: 32920880 Free PMC article. Review. - Microglial debris is cleared by astrocytes via C4b-facilitated phagocytosis and degraded via RUBICON-dependent noncanonical autophagy in mice.
Zhou T, Li Y, Li X, Zeng F, Rao Y, He Y, Wang Y, Liu M, Li D, Xu Z, Zhou X, Du S, Niu F, Peng J, Mei X, Ji SJ, Shu Y, Lu W, Guo F, Wu T, Yuan TF, Mao Y, Peng B. Zhou T, et al. Nat Commun. 2022 Oct 24;13(1):6233. doi: 10.1038/s41467-022-33932-3. Nat Commun. 2022. PMID: 36280666 Free PMC article. - Microglia in action: how aging and injury can change the brain's guardians.
Lourbopoulos A, Ertürk A, Hellal F. Lourbopoulos A, et al. Front Cell Neurosci. 2015 Feb 23;9:54. doi: 10.3389/fncel.2015.00054. eCollection 2015. Front Cell Neurosci. 2015. PMID: 25755635 Free PMC article.
References
- Ajami B, Bennett JL, Krieger C, Tetzlaff W, Rossi FM. Local self-renewal can sustain CNS microglia maintenance and function throughout adult life. Nat Neurosci. 2007;10:1538–1543. - PubMed
- Aldskogius H, Liu L, Svensson M. Glial responses to synaptic damage and plasticity. J Neurosci Res. 1999;58:33–41. - PubMed
- Aloisi F. In: Cytokine production. Neuroglia HR, Kettenmann BR, editors. New York: Oxford UP; 2005. pp. 285–301.
- Barres BA, Hart IK, Coles HS, Burne JF, Voyvodic JT, Richardson WD, Raff MC. Cell death and control of cell survival in the oligodendrocyte lineage. Cell. 1992;70:31–46. - PubMed
- Battista D, Ferrari CC, Gage FH, Pitossi FJ. Neurogenic niche modulation by activated microglia: transforming growth factor beta increases neurogenesis in the adult dentate gyrus. Eur J Neurosci. 2006;23:83–93. - PubMed
Publication types
MeSH terms
Grants and funding
- R01 NS042168/NS/NINDS NIH HHS/United States
- K08 NS044276-05/NS/NINDS NIH HHS/United States
- R01 NS042168-09/NS/NINDS NIH HHS/United States
- R01 NS064025/NS/NINDS NIH HHS/United States
- K08 NS044276/NS/NINDS NIH HHS/United States
- P30HD024064/HD/NICHD NIH HHS/United States
- R01 NS042168-07/NS/NINDS NIH HHS/United States
- K08NS0044276/NS/NINDS NIH HHS/United States
- P30 HD024064/HD/NICHD NIH HHS/United States
- R21 NS053875/NS/NINDS NIH HHS/United States
- R21 NS053875-02/NS/NINDS NIH HHS/United States
- R01 NS042168-08/NS/NINDS NIH HHS/United States
- R21NS05875-1/NS/NINDS NIH HHS/United States
LinkOut - more resources
Full Text Sources
Other Literature Sources
Molecular Biology Databases
