MicroRNA-155 promotes autoimmune inflammation by enhancing inflammatory T cell development - PubMed (original) (raw)
MicroRNA-155 promotes autoimmune inflammation by enhancing inflammatory T cell development
Ryan M O'Connell et al. Immunity. 2010.
Abstract
Mammalian noncoding microRNAs (miRNAs) are a class of gene regulators that have been linked to immune system function. Here, we have investigated the role of miR-155 during an autoimmune inflammatory disease. Consistent with a positive role for miR-155 in mediating inflammatory responses, Mir155(-/-) mice were highly resistant to experimental autoimmune encephalomyelitis (EAE). miR-155 functions in the hematopoietic compartment to promote the development of inflammatory T cells including the T helper 17 (Th17) cell and Th1 cell subsets. Furthermore, the major contribution of miR-155 to EAE was CD4(+) T cell intrinsic, whereas miR-155 was also required for optimum dendritic cell production of cytokines that promoted Th17 cell formation. Our study shows that one aspect of miR-155 function is the promotion of T cell-dependent tissue inflammation, suggesting that miR-155 might be a promising therapeutic target for the treatment of autoimmune disorders.
Copyright © 2010 Elsevier Inc. All rights reserved.
Figures
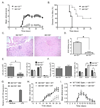
Figure 1. _Mir155_−/− mice are resistant to EAE induced by MOG35–55
A. EAE was induced in Mir155+/+ and _Mir155_−/− mice by immunizing both groups with 100 µg of the MOG35–55 peptide followed by administration of pertussis toxin. Their disease severity was scored regularly based upon clinical symptoms (n=10). Data represent three independent experiments. B. Disease incidence was assessed for each group (n=10). C. Representative H&E stained brain sections from Mir155+/+ or _Mir155_−/− mice harvested on day 25 post-immunization. D. Average histology score for each group (n=4). E. Number of live LN cells (left) and their lineage composition was assessed by flow cytometry (right) using LNs from Mir155+/+ and _Mir155_−/− mice 25 days after immunization (n=4). F. Number of splenocytes (left) and their lineage composition as determined by flow cytometry (right) using spleens from both groups 25 days after immunization (n=4). G. WT mice were lethally irradiated and reconstituted with Mir155+/+ or _Mir155_−/− BM. 4 months later, expression of miR-155 in LPS activated splenic B cells was assessed. H. MOG35–55-induced EAE was induced in mice with WT or _Mir155_−/− hematopoietic cells and disease was scored over a time course (n=5–7). I. 12 days following induction of EAE in WT mice with MOG35–55, splenocytes were harvested and cultured in 20 µg/ml MOG35–55 and 20ng/ml IL-12 p70 for 48 hours. Cells were then washed and 25×106 cells were injected intravenously into Mir155+/+ and _Mir155_−/− mice followed by administration of pertussis toxin. Mice were monitored regularly and disease severity was scored (n=5). Data represent two independent experiments. Error bars represent +/−SEM and * denotes statistical significance with a p value of <0.05 according to a student’s two-tailed t-test. See also Figure S1
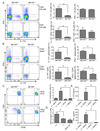
Figure 2. _Mir155_−/− mice exhibit defective inflammatory T cell development during EAE
Mir155+/+ and _Mir155_−/− mice were harvested 25 days following immunization with MOG35–55. A. Intracellular staining was conducted to identify total lymph node cells (top) and CD4+ lymphocytes (bottom) producing IL-17A and/or IFN-γ (n=4). B. Splenocytes were analyzed as in (A) (n=4). C. Mir155+/+ or _miR155_−/− splenocytes harvested from mice 25 days after EAE induction were labeled with CFSE. CFSE loss by CD4+ proliferating cells from both groups was assayed by flow cytometry following restimulation with MOG35–55 (20 µg/ml) for 72 hours (n=4). D. 3[H] thymidine incorporation was also assays using replicate cultures (n=4). 2 naïve WT mice were also included as controls. E. Production of IL-17A and IFN-γ by cells from (C.) was determined by ELISA (n=4). Data represent two independent experiments. Error bars represent +/−SEM and * denotes statistical significance with a p value of <0.05 according to a student’s two-tailed t-test. +/+ = Mir155+/+; −/− = _Mir155_−/−. See also Figure S2.
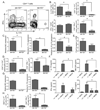
Figure 3. miR-155 is required for inflammatory T cell development during the induction phase of EAE
Mir155+/+ and _Mir155_−/− mice were harvested 13 days following immunization with MOG35–55. A. Mononuclear cells were purified from Mir155+/+ and _Mir155_−/− brains and intracellular staining was conducted to identify CD4+ lymphocytes producing IL-17A and/or IFN-γ (n=5). B. Total numbers of Th17 and Th1 cells in the brain, in addition to the percentage of Th17 and Th1 cells among total CD4+ T cells is shown on the right (n=5). C. WT and _Mir155_−/− splenocytes were analyzed for expression of BIC, IL-17A and IL-23 p19 mRNA by qPCR (n=5) and D. intracellular staining was used to determine the number of Th17 and Th1 cells (n=5). E. Splenocytes were restimulated with MOG35–55 and E. proliferation was assayed by 3[H] thymidine incorporation (n=5) and F. the production of IL-17A, IFN-γ, IL-6 and GM-CSF measured by ELISA (n=5). G. Expression of BIC and IL-17A mRNA in the LNs was assayed by qPCR (n=5) and H. the number of Th17 and Th1 cells was also quantified by flow cytometry (n=5). Error bars represent +/−SEM and * denotes statistical significance with a p value of <0.05 according to a student’s two-tailed t-test. +/+ = Mir155+/+; −/− = _Mir155_−/−. See also Figure S3.
Figure 4. _Mir155_−/− mice have reduced foot pad inflammation during DTH
Mir155+/+ and _Mir155_−/− mice were immunized with 100 µg of KLH in CFA and 8 days later injected with 50 µg of KLH in one footpad and PBS in the other. A. Increases in footpad inflammation were measured for both groups (n=5). B. Total numbers of splenocytes and LN cells was assessed (n=5). C. Proliferation of splenocytes and LN cells following in vitro restimulation with KLH was determined by assaying 3[H] thymidine incorporation (n=5). D. Production of IL-17A, IFN-γ and IL-6 from the cells in (C.) was determined by ELISA (n=5). Error bars represent +/−SEM and * denotes statistical significance with a p value of <0.05 according to a student’s t-test. +/+ = Mir155+/+; −/−= _Mir155_−/−.
Figure 5. miR-155 expression by CD4+ T cells is necessary for proper Th17 cell development in vitro
A. CD4+ T cells were isolated from Mir155+/+ or _Mir155_−/− spleens and cultured in the presence of plate bound CD3 and soluble CD28 antibodies, with (Th17 cell) and without (Th0 cell) IL-6 (50 ng/ml) and TGF-β (2 ng/ml). After 96 hours, expression of IL-17A and IFN-γ was assayed by intracellular staining following by flow cytometry. B. Results from a representative experiment are represented graphically (n=2). Data represent three independent experiments. C. Expression of Mir155 was measured by qPCR before and after activation with CD3 and CD28 antibodies (n=3). D. Expression of BIC, Mir155, and IL-17A in WT and _Mir155_−/− CD4+ T cells was assayed by qPCR following 96 hours of culture with CD3 and CD28 antibodies alone, or in Th17 cell skewing conditions (n=2). Data represent two independent experiments. Error bars represent +/−SEM.
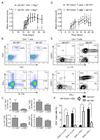
Figure 6. Expression of miR-155 by CD4+ T cells is required for proper development of inflammatory T cells during EAE
A. 5×10⁶ WT or _Mir155_−/− CD4+ T cells from naïve mice were injected i.v. into _Rag1_−/− recipients, EAE was induced with MOG35–55 24 hours later, and disease was scored over a time course (n=5–6). Data represent two independent experiments. B. Mice were harvested and engraftment of CD3+CD4+ T cells was assayed by flow cytometry using splenocytes (top). Expression of IL-17A and IFN-γ by CD4+ cells in the spleens and LNs was assayed by intracellular staining followed by flow cytometry. A representative plot from the LNs is shown (bottom). C. The averages of 5–6 mice per group are shown graphically. D. Mir155+/+ and _Mir155_−/− mice were injected with 1×10⁷ WT CD45.1+CD4+ naïve T cells, and EAE was induced 24 hours later (n=5). Disease symptoms were scored over a time course. Data represent two independent experiments. E. Mice were harvested and CD4+ T cells in the brains were analyzed by flow cytometry to detect cells expressing CD45.1, IL-17A and IFN-γ. F. The average of 5 mice per group from (E.). Error bars represent +/−SEM and * denotes statistical significance with a p value of <0.05 according to a student’s two-tailed t-test. +/+ = Mir155+/+; −/− = _Mir155_−/−. See also Figure S4.
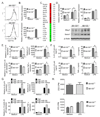
Figure 7. miR-155 expression by LPS-activated, GM-CSF-derived myeloid dendritic cells is necessary for proper production of Th17 cell relevant inflammatory cytokines
A. CD11c+ DCs were derived using GM-CSF at 20 ng/ml. B. Expression of BIC (top) and mature miR-155 (bottom) before and after 20 hours of LPS stimulation (100 ng/ml) was assayed using qPCR. C. Total RNA was next used for a microarray analysis to determine mRNA expression differences between Mir155+/+ and _Mir155_−/− LPS treated DCs. Several selected targets of miR-155 were expressed in higher amounts in _Mir155_−/− DCs, while a subset of selected proinflammatory cytokines were expressed at lower amounts. Red = higher expression and Green = lower expression in the _Mir155_−/− vs. Mir155+/+ DCs. D. Expression of SHIP1 and SOCS1 mRNAs was assessed by qPCR and by Western blotting (n=3). E. qPCR was also used to assay expression of IL-23 p19, IL-6, IL-12p40 and TNF-α mRNA amounts (n=3). Data represent two independent experiments. F. Concentrations of the cytokines from (E) in the culture supernatants were determined by ELISAs (n=3). Data represent two independent experiments. G. GM-CSF-derived DCs overexpressing miR-155, a miR-155 “seed” mutant or a control vector were stimulated with LPS for 20 hours and expression of IL-23 p19, IL-6, IL- 12p40 and TNF-α mRNA was assayed by qPCR. Data represent two independent experiments. H. Proliferation of 2D2 or OT2 CD4+ T cells in response to their respective antigens presented by WT or _Mir155_−/− DCs was assessed by assaying 3[H] thymidine incorporation (n=3). Data represent two independent experiments. Error bars represent +/−SEM and * denotes statistical significance with a p value of <0.05 according to a student’s two-tailed t-test.
Similar articles
- Disulfiram and Diphenhydramine Hydrochloride Upregulate miR-30a to Suppress IL-17-Associated Autoimmune Inflammation.
Zhao M, Sun D, Guan Y, Wang Z, Sang D, Liu M, Pu Y, Fang X, Wang D, Huang A, Bi X, Cao L, He C. Zhao M, et al. J Neurosci. 2016 Aug 31;36(35):9253-66. doi: 10.1523/JNEUROSCI.4587-15.2016. J Neurosci. 2016. PMID: 27581464 Free PMC article. - IL-17 plays an important role in the development of experimental autoimmune encephalomyelitis.
Komiyama Y, Nakae S, Matsuki T, Nambu A, Ishigame H, Kakuta S, Sudo K, Iwakura Y. Komiyama Y, et al. J Immunol. 2006 Jul 1;177(1):566-73. doi: 10.4049/jimmunol.177.1.566. J Immunol. 2006. PMID: 16785554 - Silencing microRNA-155 ameliorates experimental autoimmune encephalomyelitis.
Murugaiyan G, Beynon V, Mittal A, Joller N, Weiner HL. Murugaiyan G, et al. J Immunol. 2011 Sep 1;187(5):2213-21. doi: 10.4049/jimmunol.1003952. Epub 2011 Jul 25. J Immunol. 2011. PMID: 21788439 Free PMC article. - Control of experimental autoimmune encephalomyelitis by CD4+ suppressor T cells: peripheral versus in situ immunoregulation.
Bynoe MS, Bonorino P, Viret C. Bynoe MS, et al. J Neuroimmunol. 2007 Nov;191(1-2):61-9. doi: 10.1016/j.jneuroim.2007.09.010. Epub 2007 Sep 27. J Neuroimmunol. 2007. PMID: 17900707 Free PMC article. Review.
Cited by
- MicroRNAs in Control of Stem Cells in Normal and Malignant Hematopoiesis.
Roden C, Lu J. Roden C, et al. Curr Stem Cell Rep. 2016 Sep;2(3):183-196. doi: 10.1007/s40778-016-0057-1. Epub 2016 Jul 1. Curr Stem Cell Rep. 2016. PMID: 27547713 Free PMC article. - MicroRNA regulation of T-cell differentiation and function.
Jeker LT, Bluestone JA. Jeker LT, et al. Immunol Rev. 2013 May;253(1):65-81. doi: 10.1111/imr.12061. Immunol Rev. 2013. PMID: 23550639 Free PMC article. Review. - Genetic association and altered gene expression of mir-155 in multiple sclerosis patients.
Paraboschi EM, Soldà G, Gemmati D, Orioli E, Zeri G, Benedetti MD, Salviati A, Barizzone N, Leone M, Duga S, Asselta R. Paraboschi EM, et al. Int J Mol Sci. 2011;12(12):8695-712. doi: 10.3390/ijms12128695. Epub 2011 Dec 1. Int J Mol Sci. 2011. PMID: 22272099 Free PMC article. - Expression of the circulating and the tissue microRNAs after surgery, chemotherapy, and radiotherapy in mice mammary tumor.
Farsinejad S, Rahaie M, Alizadeh AM, Mir-Derikvand M, Gheisary Z, Nosrati H, Khalighfard S. Farsinejad S, et al. Tumour Biol. 2016 Oct;37(10):14225-14234. doi: 10.1007/s13277-016-5292-7. Epub 2016 Aug 26. Tumour Biol. 2016. PMID: 27565813 - miR-22 controls Irf8 mRNA abundance and murine dendritic cell development.
Li HS, Greeley N, Sugimoto N, Liu YJ, Watowich SS. Li HS, et al. PLoS One. 2012;7(12):e52341. doi: 10.1371/journal.pone.0052341. Epub 2012 Dec 14. PLoS One. 2012. PMID: 23251709 Free PMC article.
References
- An H, Xu H, Zhang M, Zhou J, Feng T, Qian C, Qi R, Cao X. Src homology 2 domain-containing inositol-5-phosphatase 1 (SHIP1) negatively regulates TLR4-mediated LPS response primarily through a phosphatase activity- and PI-3K-independent mechanism. Blood. 2005;105:4685–4692. - PubMed
- Bettelli E, Carrier Y, Gao W, Korn T, Strom TB, Oukka M, Weiner HL, Kuchroo VK. Reciprocal developmental pathways for the generation of pathogenic effector TH17 and regulatory T cells. Nature. 2006;441:235–238. - PubMed
Publication types
MeSH terms
Substances
Grants and funding
- K99 HL102228-02/HL/NHLBI NIH HHS/United States
- K08 CA133521/CA/NCI NIH HHS/United States
- 1K08CA133521/CA/NCI NIH HHS/United States
- K12 HD001400/HD/NICHD NIH HHS/United States
- L30 CA116228/CA/NCI NIH HHS/United States
- K99HL102228/HL/NHLBI NIH HHS/United States
- K99 HL102228/HL/NHLBI NIH HHS/United States
- K99 HL102228-01/HL/NHLBI NIH HHS/United States
- 1R01AI079243-01/AI/NIAID NIH HHS/United States
- R01 AI079243/AI/NIAID NIH HHS/United States
LinkOut - more resources
Full Text Sources
Other Literature Sources
Molecular Biology Databases
Research Materials
