Pathogenic virus-specific T cells cause disease during treatment with the calcineurin inhibitor FK506: implications for transplantation - PubMed (original) (raw)
Pathogenic virus-specific T cells cause disease during treatment with the calcineurin inhibitor FK506: implications for transplantation
Koichi Araki et al. J Exp Med. 2010.
Abstract
Recently, several cases of fatal lymphocytic choriomeningitis virus (LCMV) infection occurred in transplant recipients being treated with the immunosuppressive calcineurin inhibitor FK506. These findings were surprising because LCMV is a noncytolytic virus. To understand how a noncytolytic virus can cause disease under conditions of immunosuppression, we used the mouse LCMV model and found that, similar to the observations in human transplant recipients, LCMV infection of FK506-treated mice resulted in a lethal disease characterized by viremia, lack of seroconversion, and minimal lymphocytic infiltrates in the tissues. However, despite the apparent absence of an antiviral immune response, this disease was orchestrated by virus-specific T cells. FK506 did not prevent the generation and proliferation of LCMV-specific T cells but instead altered their differentiation so that these effector T cells lost the ability to control virus but were still capable of mediating disease. These pathogenic T cells initiated a cytokine storm characterized by high levels of tumor necrosis factor (TNF) and interleukin 6 (IL-6), and depletion of T cells or blockade of these inflammatory cytokines prevented the lethal disease. Our study shows that inhibiting calcineurin can generate pathogenic T cells and indicates that T cell-mediated viral disease can occur even under conditions of immunosuppression. Furthermore, we identify a potential strategy (blockade of TNF and IL-6) for treatment of transplant recipients who have acute complications of viral infection.
Figures
Figure 1.
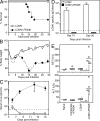
LCMV infection in the presence of FK506 results in high mortality. B6 mice were infected with LCMV Armstrong in the presence or absence of FK506 treatment. FK506 was injected subcutaneously every day into B6 mice from day −1 of infection. (A) Survival curve of LCMV Armstrong–infected mice with or without FK506 treatment (n = 6, LCMV; n = 12, LCMV + FK506). (B) Mean body weight was tracked after infection (n = 6, LCMV; n = 12, LCMV + FK506). (C) Serum viral titers were measured by plaque assay (n = 3, each time point). (D) Endpoint titers of anti-LCMV IgG in serum were detected by ELISA (n = 3, each time point). Error bars for B–D indicate SEM. (E) Aspartate aminotransferase (AST) and alanine aminotransferase (ALT) in serum were analyzed from naive FK506-treated uninfected, LCMV-infected, and LCMV-infected FK506-treated mice on days 12–15 after infection or drug treatment. Each circle represents individual animals. Horizontal bars show the mean. *, P < 0.05; **, P < 0.01. The horizontal dashed lines in C and D indicate the lower limit of detection. Data (A–E) were pooled from two independent experiments.
Figure 2.
Kinetics of LCMV-specific CD8 T cell responses in the presence of FK506. B6 mice were infected with LCMV Armstrong with or without FK506 treatment. (A) The percentage of CD8+ T cells from spleen staining positive for DbGP33 tetramer is shown for a representative mouse on days 6, 8, and 15 after infection (left). Flow cytometry plots are gated on CD8+ T cells and the number indicates the percentage of DbGP33 tetramer+ cells. Shown on the right is the mean number of CD8+ T cells/spleen specific for the DbGP33 epitope (n = ∼3–6, each time point). *, P < 0.01. (B) The mean number of CD8+ T cells/spleen specific for other three dominant epitopes (left, DbNP396; center, DbGP276; right, KbGP34) at days 6 and 8 after infection in control and FK506-treated mice (n = ∼3–6, each time point). Error bars in A and B indicate SEM. The horizontal dotted lines in A and B show the lower limit of detection. *, P < 0.05; **, P < 0.01; ***, P < 0.0001. Data for A and B are representative of two or three independent experiments.
Figure 3.
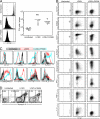
FK506 treatment alters effector CD8 T cell differentiation. B6 mice were infected with LCMV Armstrong with or without FK506 treatment. (A) Phenotype of DbGP33 tetramer+ CD8+ cells was compared between FK506-treated and untreated mice on day 8 after infection. Flow cytometry data are gated on DbGP33 tetramer+ CD8+ cells. The gray line shows CD8+ T cells of naive B6 mice. (B) IFN-γ and TNF production of spleen CD8 T cells stimulated or not with GP33 peptide for 5 h on days 6 and 8 after infection. For better comparison of frequencies of tetramer-positive cells and cytokine-producing cells, DbGP33 and KbGP34 tetramer-positive cells were detected together in one flow panel. The flow cytometry plots of each panel are gated on CD8+ T cells. (C) Granzyme B expression in DbGP33 tetramer+ CD8+ T cells was examined on day 8 after infection. The gray line shows granzyme B levels in CD8+ T cells of a naive mouse. The number represents mean fluorescence intensity of granzyme B in DbGP33+ cells (black histogram). (D) Ex vivo cytotoxic activity of spleen cells isolated from FK506-treated or untreated LCMV-infected mice on day 8 after infection was measured in a 5-h chromium release assay. Target cells were GP33 peptide-pulsed or unpulsed MC57 cells. The effector/target cell ratios (E:T) of the top two panels show total spleen cells to targets. The effector/target cell ratios of the bottom panel were calculated by antigen-specific tetramer-positive cells. Error bars indicate SEM. (E) The expression of PD-1 on DbGP33 tetramer+ CD8+ cells was compared between spleen cells of FK506-treated and untreated mice on day 8 after infection. As a positive control, PD-1 expression after LCMV strain clone 13 infection (day 8 after infection) is shown on the bottom. Flow cytometry data are gated on DbGP33 tetramer+ CD8+ cells. The gray line shows CD8+ T cells of naive B6 mice. Data (A–E) are representative of at least two independent experiments.
Figure 4.
FK506 acts intrinsically in virus-specific CD8 T cells to alter T cell differentiation. Thy-1.1+ LCMV-specific P14 transgenic naive CD8 T cells were activated in vivo and then transduced with retroviruses (marked by GFP expression) expressing shRNA for FKBP12 or empty control vector. These transduced P14 cells were then adoptively transferred into naive Thy-1.2+ mice and these mice were infected with LCMV in the presence of FK506. Spleen cells were used for analysis on day 5 after infection. (A) Retrovirus-transduced Thy-1.1+ P14 cells were distinguished by GFP expression. The dot plots are gated on P14 cells. (B) GFP+ retrovirus-transduced P14 cells were purified by FACS, and then FKBP12 expression was examined by Western blotting. (C) Phenotypic and functional analysis of retrovirus-transduced cells. PD-1 and cytokine expression (IFN-γ and TNF upon peptide stimulation) on retrovirus-transduced (GFP+) and nontransduced (GFP−) P14 cells in spleen cells on day 5 after infection. For cytokine expression, spleen cells were stimulated with GP33 peptide for 5 h. Data are representative of three independent experiments.
Figure 5.
Virus-specific T cells proliferate but do not accumulate in the presence of FK506. CFSE-labeled P14 transgenic T cells that bear GP33-specific TCR and Thy-1.1 marker were adoptively transferred into Thy-1.2+ recipient B6 mice 1 d before infection, and then FK506 treatment was started. The next day (day 0), these mice were infected or not with LCMV Armstrong, and spleen cells were isolated on day 4 after infection for analysis. (A) Proliferation and the absolute number of P14 cells were assessed in spleen. Histograms were gated on P14 Thy-1.1+ CD8+ transgenic T cells. Horizontal bars (right) show the geometric mean. (B and C) Cell surface and functional markers on gated Thy-1.1+ CD8+ P14 cells. For cytokine expression, spleen cells were stimulated with GP33 peptide for 5 h. Flow cytometry plots in B are shown as histograms in C. (D) Apoptosis of effector CD8 T cells as determined by Annexin V and 7AAD staining. Plots are gated on P14 transgenic T cells. Data (A–D) are representative of two or three independent experiments.
Figure 6.
CD4 T cell responses in FK506-treated mice. B6 mice were infected with LCMV Armstrong in the presence or absence of FK506. (A) The number of CD44High CD4+ T cells/spleen is plotted over time after infection. Data are the mean for three mice/time point. Error bars indicate SEM. *, P < 0.05; **, P < 0.01. (B) The percentage of CD44high CD4+ T cells staining positive for granzyme B is shown for spleen cells of a representative mouse at each time point. (C) IFN-γ production by CD4+ T cells stimulated with LCMV peptide for each group 8 d after infection. Spleen cells were stimulated with GP61 peptide (LCMV CD4 epitope) or left unstimulated for 5 h. Numbers represent the percentage of IFN-γ+ cells in CD4 T+ cells. Data (A–C) are representative of two independent experiments.
Figure 7.
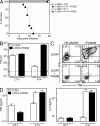
Pathogenic T cells orchestrate inflammatory cytokine production. B6 mice were infected with LCMV Armstrong in the presence or absence of FK506. (A) For single depletion of CD4+ and CD8+ T cells, either anti-CD4 or anti-CD8 antibody was injected i.p. into LCMV-infected B6 mice on day 0 and day 3 of infection. For double depletion of CD4+ and CD8+ T cells, both anti-CD4 and -CD8 antibodies were injected. Survival curves are shown on the left (n = 21, LCMV + FK506; n = 13, LCMV + FK506 + CD4 depletion; n = 17, LCMV + FK506 + CD8 depletion; n = 9, LCMV + FK506 + double depletion). *, P < 0.05 (vs. LCMV + FK506). For viral titer, sera were collected at three different time points (days 6, 12–15, and 30 after infection). The mean viral titer in serum is shown (n = 3–9, each time point). (B) Serum cytokine levels were measured using cytometric bead array (n = 3–9, each time point). The horizontal dashed lines indicate the lower limit of detection. There were no detectable levels of IFN-γ, TNF, and IL-6 in serum of uninfected mice treated with FK506 for 15 d (not depicted). Error bars in A and B indicate SEM. Data for A and B were pooled from two or three independent experiments.
Figure 8.
Functionally impaired virus-specific T cells mediate LCMV lethal disease in FK506-treated mice. Purified P14 (LCMV specific) or OT-1 (nonspecific) transgenic CD8 T cells were adoptively transferred into RAG1−/− mice, followed by LCMV infection in the presence or absence of FK506. (A) Survival curve (n = 6, LCMV + OT-1; n = 6, LCMV + OT-1 + FK506; n = 11, LCMV + P14; n = 12, LCMV + P14 + FK506). (B) Serum viral titers (n = 5–6 in each group, day 9 after infection). The horizontal dashed line indicates the lower limit of detection. (C) IFN-γ and TNF production by P14 cell transfer is shown on day 7 after infection for a representative mouse from two independent experiments. Spleen cells were stimulated or not with GP33 peptide for 5 h. The flow cytometry plots of each panel are gated on P14 cells. (D) Serum cytokine levels on day 9 after infection for each of the four groups were measured using cytometric bead array (n = 5–6, each group). *, P < 0.05; **, P < 0.01. Error bars in B and D indicate SEM. Data (A, B, and D) were pooled from two independent experiments.
Figure 9.
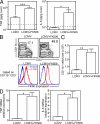
Liver macrophages produce inflammatory cytokines in LCMV-infected FK506-treated mice. Liver cytokine levels and intrahepatic mononuclear cells were examined 15 d after LCMV infection in the presence or absence of FK506. (A) Inflammatory cytokine expression in the liver, quantified by cytometric bead array in liver homogenates (n = 6, each group). The horizontal dashed lines indicate the lower limit of detection. (B) Flow plots show CD11b and CD3 staining patterns in intrahepatic mononuclear cells (top) and F4/80 staining in CD11b+ CD3− cells (bottom). (C) Accumulation of CD11b+ CD3− cells in the liver of FK506-treated mice (n = 6, each group). (D) Quantitative RT-PCR analysis of inflammatory cytokine expression in CD11b+ cells (n = 3, each group). *, P < 0.05; **, P < 0.01; ***, P < 0.001. Error bars in A, C, and D indicate SEM. Data (A–D) are representative of two or three independent experiments.
Figure 10.
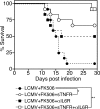
Overproduction of inflammatory cytokines responsible for lethal disease in LCMV-infected FK506-treated mice. B6 mice were infected with LCMV Armstrong in the presence or absence of FK506. Mice were treated with soluble TNF receptor (sTNFR), which is an inhibitor of TNF and/or anti–IL-6 receptor antibody (±IL6R), from day 4 after infection. Survival curve is shown (n = 12, all groups). *, P < 0.01; **, P < 0.0001. Data were pooled from two or three independent experiments.
Similar articles
- The role of proinflammatory cytokines in wasting disease during lymphocytic choriomeningitis virus infection.
Kamperschroer C, Quinn DG. Kamperschroer C, et al. J Immunol. 2002 Jul 1;169(1):340-9. doi: 10.4049/jimmunol.169.1.340. J Immunol. 2002. PMID: 12077263 - Immunosuppression by lymphocytic choriomeningitis virus infection: competent effector T and B cells but impaired antigen presentation.
Althage A, Odermatt B, Moskophidis D, Kündig T, Hoffman-Rohrer U, Hengartner H, Zinkernagel RM. Althage A, et al. Eur J Immunol. 1992 Jul;22(7):1803-12. doi: 10.1002/eji.1830220720. Eur J Immunol. 1992. PMID: 1623925 - Dissection of antiviral and immune regulatory functions of tumor necrosis factor receptors in a chronic lymphocytic choriomeningitis virus infection.
Suresh M, Gao X, Fischer C, Miller NE, Tewari K. Suresh M, et al. J Virol. 2004 Apr;78(8):3906-18. doi: 10.1128/jvi.78.8.3906-3918.2004. J Virol. 2004. PMID: 15047807 Free PMC article. - General and specific immunosuppression caused by antiviral T-cell responses.
Zinkernagel RM, Planz O, Ehl S, Battegay M, Odermatt B, Klenerman P, Hengartner H. Zinkernagel RM, et al. Immunol Rev. 1999 Apr;168:305-15. doi: 10.1111/j.1600-065x.1999.tb01300.x. Immunol Rev. 1999. PMID: 10399082 Review. - Chronic LCMV Infection Is Fortified with Versatile Tactics to Suppress Host T Cell Immunity and Establish Viral Persistence.
Studstill CJ, Hahm B. Studstill CJ, et al. Viruses. 2021 Sep 29;13(10):1951. doi: 10.3390/v13101951. Viruses. 2021. PMID: 34696381 Free PMC article. Review.
Cited by
- PepT1-targeted nanodrug based on co-assembly of anti-inflammatory peptide and immunosuppressant for combined treatment of acute and chronic DSS-induced ColitiS.
Zhang D, Jiang L, Yu F, Yan P, Liu Y, Wu Y, Yang X. Zhang D, et al. Front Pharmacol. 2024 Aug 15;15:1442876. doi: 10.3389/fphar.2024.1442876. eCollection 2024. Front Pharmacol. 2024. PMID: 39211778 Free PMC article. - Pyrimidine de novo synthesis inhibition selectively blocks effector but not memory T cell development.
Scherer S, Oberle SG, Kanev K, Gerullis AK, Wu M, de Almeida GP, Puleston DJ, Baixauli F, Aly L, Greco A, Nizharadze T, Becker NB, Hoesslin MV, Donhauser LV, Berner J, Chu T, McNamara HA, Esencan Z, Roelli P, Wurmser C, Kleiter I, Vehreschild MJGT, Mayer CA, Knolle P, Klingenspor M, Fumagalli V, Iannacone M, Prlic M, Korn T, Pearce EL, Höfer T, Schulz AM, Zehn D. Scherer S, et al. Nat Immunol. 2023 Mar;24(3):501-515. doi: 10.1038/s41590-023-01436-x. Epub 2023 Feb 16. Nat Immunol. 2023. PMID: 36797499 - CD38 reduces mitochondrial fitness and cytotoxic T cell response against viral infection in lupus patients by suppressing mitophagy.
Chen PM, Katsuyama E, Satyam A, Li H, Rubio J, Jung S, Andrzejewski S, Becherer JD, Tsokos MG, Abdi R, Tsokos GC. Chen PM, et al. Sci Adv. 2022 Jun 17;8(24):eabo4271. doi: 10.1126/sciadv.abo4271. Epub 2022 Jun 15. Sci Adv. 2022. PMID: 35704572 Free PMC article. - The Molecular Virology of Coronaviruses with Special Reference to SARS-CoV-2.
Clayton E, Rohaim MA, Bayoumi M, Munir M. Clayton E, et al. Adv Exp Med Biol. 2021;1352:15-31. doi: 10.1007/978-3-030-85109-5_2. Adv Exp Med Biol. 2021. PMID: 35132592 Review. - Tacrolimus exposure windows responsible for Listeria monocytogenes infection susceptibility.
Miller-Handley H, Erickson JJ, Gregory EJ, Prasanphanich NS, Shao TY, Way SS. Miller-Handley H, et al. Transpl Infect Dis. 2021 Aug;23(4):e13655. doi: 10.1111/tid.13655. Epub 2021 Jun 22. Transpl Infect Dis. 2021. PMID: 34057792 Free PMC article.
References
- Ahmed R., Salmi A., Butler L.D., Chiller J.M., Oldstone M.B. 1984. Selection of genetic variants of lymphocytic choriomeningitis virus in spleens of persistently infected mice. Role in suppression of cytotoxic T lymphocyte response and viral persistence. J. Exp. Med. 160:521–540 10.1084/jem.160.2.521 - DOI - PMC - PubMed
- Borrow P., Oldstone M.B.A. 1997. Lymphocytic choriomeningitis virus. Viral pathogenesis. Nathanson N., editor Lippincott-Raven, Philadelphia: 593–627
- Buchmeier M.J., de la Torre J.C., Peters C.J. 2007. Arenaviridae: The viruses and their replication. Fields Virology. Vol. 2 Knipe D.M., Howley P.M., Lippincott Williams & Wilkins, Philadelphia: 1791–1827
Publication types
MeSH terms
Substances
Grants and funding
- R01 AI073707/AI/NIAID NIH HHS/United States
- R01 AI040519/AI/NIAID NIH HHS/United States
- R37 AI040519/AI/NIAID NIH HHS/United States
- N01AI30048/AI/NIAID NIH HHS/United States
- AI40519/AI/NIAID NIH HHS/United States
- AI073707/AI/NIAID NIH HHS/United States
- AI30048/AI/NIAID NIH HHS/United States
- R01 AI139675/AI/NIAID NIH HHS/United States
LinkOut - more resources
Full Text Sources
Other Literature Sources
Research Materials
