Lipocalin 2 is essential for chronic kidney disease progression in mice and humans - PubMed (original) (raw)
. 2010 Nov;120(11):4065-76.
doi: 10.1172/JCI42004.
Khalil El Karoui, Denise Laouari, Martine Burtin, Clément Nguyen, Kiyoshi Mori, Evangéline Pillebout, Thorsten Berger, Tak Wah Mak, Bertrand Knebelmann, Gérard Friedlander, Jonathan Barasch, Fabiola Terzi
Affiliations
- PMID: 20921623
- PMCID: PMC2964970
- DOI: 10.1172/JCI42004
Lipocalin 2 is essential for chronic kidney disease progression in mice and humans
Amandine Viau et al. J Clin Invest. 2010 Nov.
Abstract
Mechanisms of progression of chronic kidney disease (CKD), a major health care burden, are poorly understood. EGFR stimulates CKD progression, but the molecular networks that mediate its biological effects remain unknown. We recently showed that the severity of renal lesions after nephron reduction varied substantially among mouse strains and required activation of EGFR. Here, we utilized two mouse strains that react differently to nephron reduction--FVB/N mice, which develop severe renal lesions, and B6D2F1 mice, which are resistant to early deterioration--coupled with genome-wide expression to elucidate the molecular nature of CKD progression. Our results showed that lipocalin 2 (Lcn2, also known as neutrophil gelatinase-associated lipocalin [NGAL]), the most highly upregulated gene in the FVB/N strain, was not simply a marker of renal lesions, but an active player in disease progression. In fact, the severity of renal lesions was dramatically reduced in Lcn2-/- mice. We discovered that Lcn2 expression increased upon EGFR activation and that Lcn2 mediated its mitogenic effect during renal deterioration. EGFR inhibition prevented Lcn2 upregulation and lesion development in mice expressing a dominant negative EGFR isoform, and hypoxia-inducible factor 1α (Hif-1α) was crucially required for EGFR-induced Lcn2 overexpression. Consistent with this, cell proliferation was dramatically reduced in Lcn2-/- mice. These data are relevant to human CKD, as we found that LCN2 was increased particularly in patients who rapidly progressed to end-stage renal failure. Together our results uncover what we believe to be a novel function for Lcn2 and a critical pathway leading to progressive renal failure and cystogenesis.
Figures
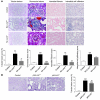
Figure 1. Lcn2 is overexpressed after nephron reduction in mice and correlates with lesion progression.
(A and B) Lcn2 expression evaluated by (A) in situ hybridization (original magnification, ×100) and (B) immunohistochemistry (×200) in kidneys from sham-operated (control) and 75% Nx FVB/N mice 2 months after surgery. Representative images for each group (n ≥ 6) are shown. (C) Correlation between renal Lcn2 mRNA expression evaluated by real-time RT-PCR and tubular lesion score in FVB/N mice, 2 months after Nx (r = 0.87, P < 0.001). (D) Correlation between renal Lcn2 protein expression evaluated by Western blot and tubular lesion score in FVB/N mice, 2 months after Nx (r = 0.74, P < 0.01). (E) Urinary Lcn2 excretion significantly correlates with renal Lcn2 protein expression. Left panel: Western blot of renal and urinary Lcn2 protein in control (C) and Nx FVB/N mice. Protein extracts from kidney of Nx Lcn2–/– mice was used as negative control (C–). Right panel: Correlation between renal Lcn2 production and urinary Lcn2 excretion evaluated by Western blot (r = 0.99, P < 0.01).
Figure 2. Lcn2 is overexpressed in polycystic kidney disease in mice and humans and correlates with CKD progression.
(A and B) Lcn2 expression evaluated by (A) immunohistochemistry and (B) Western blot in kidneys from wild-type (control) and jck mice, 3 weeks after birth. Representative images and blots for each group (n ≥ 4) are shown. Original magnification, ×200. (C) LCN2 staining in kidneys from controls (n = 9) and patients with ADPKD (n = 9). Original magnification, ×100. (D) Urinary LCN2 excretion in patients with slow progression (eGFR decline <4.5 ml/min/1.73 m2 per year) as compared with fast progressors (eGFR decline >4.5 ml/min/1.73 m2 per year) toward ESRF. (E) Urinary LCN2 excretion inversely correlates with eGFR in patients with ADPKD (r = –0.77, P < 0.0001). Data are mean ± SEM; n = 4–6 for mice and n = 87 for ADPKD patients. Mann-Whitney U test: *P < 0.05, control versus jck mice; **P < 0.01 slow versus fast progressors.
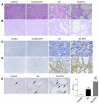
Figure 3. Lcn2 deficiency protects from the development of renal lesions.
(A) Morphology and lesion scores of kidneys from control, 75% Nx Lcn2+/+, and Lcn2–/– FVB/N mice, 2 months after nephron reduction. Original magnification, ×200, ×600, and ×400 for tubular, glomerular, and interstitial lesions, respectively. (B) Morphology and cystic surface of kidneys from control, jck/Lcn2+/+, and jck/Lcn2–/– mice, 3 weeks after birth. Original magnification, ×200. Because no differences were detected between wild-type and mutant control mice, results for only 1 group are shown. Data are mean ± SEM; n = 4–6, 10–12, and 5–6 for control, Nx, and jck mice, respectively. ANOVA followed by Tukey-Kramer test: **P < 0.01, ***P < 0.001, control versus Nx or jck mice; ##P < 0.01, ###P < 0.001, Lcn2+/+ versus Lcn2–/–.
Figure 4. Lcn2 inactivation does not affect the response to nephron reduction in the lesion-resistant C57BL/6 mice.
Morphology of kidneys from control, 75% Nx Lcn2+/+, and Lcn2–/– C57BL/6 mice, 2 months after surgery. Original magnification, ×200, ×600, and ×400 for tubular, glomerular, and interstitial lesions, respectively. Because no differences were detected between wild-type and mutant control mice, results for only 1 group are shown. n = 4–6 and 8–10 for control and Nx mice, respectively.
Figure 5. DFO increases Lcn2 expression and worsens renal lesions after nephron reduction.
(A) Perls staining of kidneys from control and 75% Nx mice either treated or not with DFO. Original magnification, ×200. (B) Morphology of kidneys from control, DFO-treated control, Nx, and Nx DFO-treated mice, 2 months after surgery. Original magnification, ×200. (C and D) Lcn2 expression evaluated by (C) in situ hybridization (×100) and (D) immunohistochemistry (×200) in kidneys from control and Nx mice treated or not with DFO, 2 months after surgery. (E) DFO enhances cell proliferation after nephron reduction. PCNA staining (black arrows) and quantification of PI in kidneys from control and Nx mice, either treated or not with DFO. Original magnification, ×400. Because no differences were detected between wild-type and DFO-treated control mice, results for only 1 group are shown. Data are mean ± SEM; n = 4–10. ANOVA followed by Tukey-Kramer test: **P < 0.01, ***P < 0.001, control versus Nx mice; ##P < 0.001, Nx versus Nx DFO-treated mice.
Figure 6. Lcn2 is a transcriptional target of EGFR.
Lcn2 protein (A) and mRNA (B) expression in mIMCD-3 cells, 24 hours after EGF treatment. (C and D) Overexpression of a dominant negative EGFR isoform abolishes renal Lcn2 synthesis and prevents lesion development after nephron reduction. (C) Lcn2 mRNA expression visualized by in situ hybridization (original magnification, ×100) and (D) renal morphology (PAS, ×200) of kidneys from control and 75% Nx wild-type and EGFR-M mice, 2 months after surgery. Data are mean ± SEM; n = 2–3 and 6–10 for in vitro and in vivo experiments, respectively. Wilcoxon test: *P < 0.05, vehicle- versus EGF-treated cells.
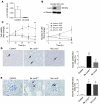
Figure 7. Hif-1α is a critical intermediate between EGFR and Lcn2.
(A) Hif-1α protein expression and quantification in control and 75% Nx mice, 2 months after surgery. (B) Pimonidazole immunostaining in control and Nx mice, 2 months after surgery. Postischemic kidneys (2 hours clamping of renal pedicle) were used as positive hypoxic control. Original magnification, ×200. (C) Hif-1α protein expression and quantification in mIMCD-3 cells, 24 hours after EGF treatment. (D) Hif-1α silencing partially overcomes EGFR-induced Lcn2 upregulation. Hif-1α and Lcn2 protein expression in either mock- (Control) or Hif-1α siRNA–transfected (siHif-1α) mIMCD-3 cells, treated or not with EGF. Data are mean ± SEM; n = 2–6 and 6–10 for in vitro and in vivo experiments, respectively. Mann-Whitney U test: *P < 0.05, control versus Nx mice; Wilcoxon test: *P < 0.05, vehicle versus EGF-treated cells.
Figure 8. Lcn2 mediates the proliferative effect of EGFR.
(A and B) Stable Lcn2 shRNA (shLcn2) inhibits Lcn2 expression in mIMCD-3 cell lines. mRNA (A) and protein (B) expression in shLcn2 cells as compared with scrambled shRNA cells (Control). (C) Cell proliferation assay (left panel) and cell counting (right panel) in scrambled shRNA and Lcn2 shRNA mIMCD-3 cells, treated or not with EGF. (D) PCNA staining (black arrows) and quantification of tubular proliferation in kidneys from control, 75% Nx Lcn2+/+, and Lcn2–/– mice, 2 months after surgery. Original magnification, ×400. (E) PCNA staining (black arrow) and quantification of glomerular proliferation in kidneys from control, Nx Lcn2+/+, and Lcn2–/– mice, 2 months after surgery. Original magnification, ×600. Because no differences were detected between wild-type and mutant control mice, results for only 1 group are shown. Data are mean ± SEM; n = 3–4 and 6–10 for in vitro and in vivo experiments, respectively. ANOVA followed by Tukey-Kramer test: **P < 0.01, control versus shLcn2 cell lines; *P < 0.05, **P < 0.01, control versus Nx mice; #P < 0.05, Nx Lcn2+/+ versus Nx Lcn2–/– mice.
Figure 9. Impact of Lcn2 inactivation on apoptosis.
(A) TUNEL assay and quantification of TUNEL-positive tubular cells (white arrows) in kidneys from control, 75% Nx Lcn2+/+, and Lcn2–/– mice, 2 months after surgery. Original magnification, ×400. (B) TUNEL assay and quantification of TUNEL-positive glomerular cells (white arrows) in kidneys from control, Nx Lcn2+/+, and Lcn2–/– mice, 2 months after surgery. G, glomerulus. Original magnification, ×600. Because no differences were detected between wild-type and mutant control mice, results for only 1 group are shown. (C) Cell apoptosis quantification in scrambled shRNA and Lcn2 shRNA mIMCD-3 cells, 24 hours after EGF treatment. Data are mean ± SEM; n = 3 and 4 for in vitro and in vivo experiments, respectively. ANOVA followed by Tukey-Kramer test: **P < 0.01, ***P < 0.001, control versus Nx mice; ##P < 0.01, ###P < 0.001, Nx Lcn2+/+ versus Nx Lcn2–/– mice.
Similar articles
- Lipocalin-2/neutrophil gelatinase-B associated lipocalin is strongly induced in hearts of rats with autoimmune myocarditis and in human myocarditis.
Ding L, Hanawa H, Ota Y, Hasegawa G, Hao K, Asami F, Watanabe R, Yoshida T, Toba K, Yoshida K, Ogura M, Kodama M, Aizawa Y. Ding L, et al. Circ J. 2010 Mar;74(3):523-30. doi: 10.1253/circj.cj-09-0485. Epub 2010 Jan 7. Circ J. 2010. PMID: 20057160 - The multifaceted roles of neutrophil gelatinase associated lipocalin (NGAL) in inflammation and cancer.
Chakraborty S, Kaur S, Guha S, Batra SK. Chakraborty S, et al. Biochim Biophys Acta. 2012 Aug;1826(1):129-69. doi: 10.1016/j.bbcan.2012.03.008. Epub 2012 Mar 31. Biochim Biophys Acta. 2012. PMID: 22513004 Free PMC article. Review. - Lipocalin-2 negatively modulates the epithelial-to-mesenchymal transition in hepatocellular carcinoma through the epidermal growth factor (TGF-beta1)/Lcn2/Twist1 pathway.
Wang YP, Yu GR, Lee MJ, Lee SY, Chu IS, Leem SH, Kim DG. Wang YP, et al. Hepatology. 2013 Oct;58(4):1349-61. doi: 10.1002/hep.26467. Epub 2013 Aug 7. Hepatology. 2013. PMID: 23696034 - Lipocalin 2 regulation by thermal stresses: protective role of Lcn2/NGAL against cold and heat stresses.
Roudkenar MH, Halabian R, Roushandeh AM, Nourani MR, Masroori N, Ebrahimi M, Nikogoftar M, Rouhbakhsh M, Bahmani P, Najafabadi AJ, Shokrgozar MA. Roudkenar MH, et al. Exp Cell Res. 2009 Nov 1;315(18):3140-51. doi: 10.1016/j.yexcr.2009.08.019. Epub 2009 Sep 2. Exp Cell Res. 2009. PMID: 19732769 - Neutrophil gelatinase-associated lipocalin-mediated iron traffic in kidney epithelia.
Schmidt-Ott KM, Mori K, Kalandadze A, Li JY, Paragas N, Nicholas T, Devarajan P, Barasch J. Schmidt-Ott KM, et al. Curr Opin Nephrol Hypertens. 2006 Jul;15(4):442-9. doi: 10.1097/01.mnh.0000232886.81142.58. Curr Opin Nephrol Hypertens. 2006. PMID: 16775460 Review.
Cited by
- A systematic review of the implications of lipocalin-2 expression in periodontal disease.
Solís-Suárez DL, Cifuentes-Mendiola SE, García-Hernández AL. Solís-Suárez DL, et al. Evid Based Dent. 2024 Nov 8. doi: 10.1038/s41432-024-01070-y. Online ahead of print. Evid Based Dent. 2024. PMID: 39516276 - Multiomics profiling of mouse polycystic kidney disease progression at a single-cell resolution.
Muto Y, Yoshimura Y, Wu H, Chang-Panesso M, Ledru N, Woodward OM, Outeda P, Cheng T, Mahjoub MR, Watnick TJ, Humphreys BD. Muto Y, et al. Proc Natl Acad Sci U S A. 2024 Oct 22;121(43):e2410830121. doi: 10.1073/pnas.2410830121. Epub 2024 Oct 15. Proc Natl Acad Sci U S A. 2024. PMID: 39405347 - A Focus on the Proximal Tubule Dysfunction in Dent Disease Type 1.
de Combiens E, Sakhi IB, Lourdel S. de Combiens E, et al. Genes (Basel). 2024 Sep 7;15(9):1175. doi: 10.3390/genes15091175. Genes (Basel). 2024. PMID: 39336766 Free PMC article. Review. - Interrelationships among metabolic syndrome, bone-derived cytokines, and the most common metabolic syndrome-related diseases negatively affecting bone quality.
Martiniakova M, Mondockova V, Kovacova V, Babikova M, Zemanova N, Biro R, Penzes N, Omelka R. Martiniakova M, et al. Diabetol Metab Syndr. 2024 Sep 6;16(1):217. doi: 10.1186/s13098-024-01440-7. Diabetol Metab Syndr. 2024. PMID: 39238022 Free PMC article. Review. - Activation of limbal epithelial proliferation is partly controlled by the ACE2-LCN2 pathway.
Jiang H, Liu M, Yang W, Hong YK, Xu D, Nalbant EK, Clutter ED, Foroozandeh P, Kaplan N, Wysocki J, Batlle D, Miller SD, Lu K, Peng H. Jiang H, et al. iScience. 2024 Jul 18;27(8):110534. doi: 10.1016/j.isci.2024.110534. eCollection 2024 Aug 16. iScience. 2024. PMID: 39175771 Free PMC article.
References
- Meguid El Nahas A, Bello AK. Chronic kidney disease: the global challenge. Lancet. 2005;365(9456):331–340. - PubMed
- Kidney and Urologic Diseases Statistics for the United States. National Kidney and Urologic Diseases Information Clearinghouse (NKUDIC) Web Site. http://kidney.niddk.nih.gov/kudiseases/pubs/kustats/index.htm . Accessed August 10, 2010.
- Terzi F, et al. Subtotal but not unilateral nephrectomy induces hyperplasia and protooncogene expression. Am J Physiol. 1995;268(5 pt 2):F793–F801. - PubMed
Publication types
MeSH terms
Substances
LinkOut - more resources
Full Text Sources
Other Literature Sources
Medical
Molecular Biology Databases
Research Materials
Miscellaneous


