O-linked beta-N-acetylglucosamine (O-GlcNAc) regulates stress-induced heat shock protein expression in a GSK-3beta-dependent manner - PubMed (original) (raw)
O-linked beta-N-acetylglucosamine (O-GlcNAc) regulates stress-induced heat shock protein expression in a GSK-3beta-dependent manner
Zahra Kazemi et al. J Biol Chem. 2010.
Abstract
To investigate the mechanisms by which O-linked β-N-acetylglucosamine modification of nucleocytoplasmic proteins (O-GlcNAc) confers stress tolerance to multiple forms of cellular injury, we explored the role(s) of O-GlcNAc in the regulation of heat shock protein (HSP) expression. Using a cell line in which deletion of the O-GlcNAc transferase (OGT; the enzyme that adds O-GlcNAc) can be induced by 4-hydroxytamoxifen, we screened the expression of 84 HSPs using quantitative reverse transcriptase PCR. In OGT null cells the stress-induced expression of 18 molecular chaperones, including HSP72, were reduced. GSK-3β promotes apoptosis through numerous pathways, including phosphorylation of heat shock factor 1 (HSF1) at Ser(303) (Ser(P)(303) HSF1), which inactivates HSF1 and inhibits HSP expression. In OGT null cells we observed increased Ser(P)(303) HSF1; conversely, in cells in which O-GlcNAc levels had been elevated, reduced Ser(P)(303) HSF1 was detected. These data, combined with those showing that inhibition of GSK-3β in OGT null cells recovers HSP72 expression, suggests that O-GlcNAc regulates the activity of GSK-3β. In OGT null cells, stress-induced inactivation of GSK-3β by phosphorylation at Ser(9) was ablated providing a molecular basis for these findings. Together, these data suggest that stress-induced GlcNAcylation increases HSP expression through inhibition of GSK-3β.
Figures
FIGURE 1.
Characterization of the inducible OGT knockout. A, MEFs (OGT_F_/Y) were stably transfected with mER-Cre-2A-GFP. This construct encodes one transcript that is translated as two proteins, a Cre-recombinase estrogen receptor fusion protein and GFP. Cells transfected with mER-Cre-2A-GFP were treated with and without 0.5 μ
m
4HT for 24 h. B, cells were harvested at regular intervals (as indicated) and the expression of _O_-GlcNAc, OGT, and _O_-GlcNAcase were determined by immunoblot (IB). Actin is shown as a loading control (n = 3; representative data shown). C, densitometry of O_-GlcNAc (black), OGT (white), and O_-GlcNAcase (gray) in OGT null cells relative to wild-type cells are shown. Error bars represent one standard deviation. D, cell growth was assessed every 24 h using the CellTiter 96® AQ reagent (n = 3, 12 replicates per experiment). MEFs (OGT_F/Y) transfected with GFP are depicted by a dashed line, +4HT (●) and −4HT (○). Whereas, MEFs (OGT_F/Y) transfected with mER-Cre-2A-GFP are depicted by a solid line, + 4HT (▴) and −4HT (△). Cells that are null for OGT are in gray. Error bars represent one standard deviation.
FIGURE 2.
Deletion of OGT alters the expression of 21 molecular chaperones, including HSP72. OGT wild-type and null cells (38 h post-OGT deletion) were heat stressed at 45 °C for 30, 60, or 60 min with 30 min recovery at 37 °C. The last time point in the experiment was harvested 39.5 h post-OGT deletion. mRNA was quantified using RT-PCR (n = 3). A, a comparison of basal mRNA expression in OGT wild-type (control group) and OGT null (group 1) cells. The bars represent a 1.5-fold change in expression. Transcripts down-regulated in OGT null cells are indicated in red, whereas transcripts up-regulated in OGT null cells are highlighted in green. B, expression of Dnajb11, a protein whose stress-induced expression is not altered in OGT null cells. C, expression of Dnajc5G, a protein whose stress-induced expression is up-regulated in OGT null cells. D, expression of Hsp70a1a, a protein whose stress-induced expression is down-regulated in OGT null cells. Error bars represent one standard deviation.
FIGURE 3.
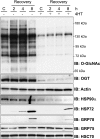
Deletion of OGT abrogates the expression of HSP72, HSP90, and GRP78, but not the closely related chaperones GRP75 and HSC70. OGT wild-type and null cells (38 h post-OGT deletion) were heat stressed at 45 °C for 60 min, and recovered at 37 °C for 2, 4, or 8 h. Cells were harvested 41, 43, and 47 h post-OGT deletion. The expression of OGT, _O_-GlcNAc, and the HSPs HSP72, HSC70, GRP78, and GRP75 were assessed by immunoblot (IB) (n = 5). Actin is shown as a loading control.
FIGURE 4.
Stress-induced _O_-GlcNAcylation is required for appropriate HSP72 expression. The _O_-GlcNAcase inhibitor GlcNAc-thiazaline (GT; 20 μ
m
) was incubated with OGT wild-type and null cells concurrent with 4HT treatment (time = 0 h post-OGT deletion). GlcNAc-thiazaline (20 μ
m
) was replaced 18 h prior to the induction of the experiment (time = 12 h post-OGT deletion). OGT wild-type and null cells with and without GlcNAc-thiazaline were heat stressed (45 °C, 1 h, time = 30 h post-OGT deletion) and returned to 37 °C for 1, 2, and 4 h (time = 32, 33, and 34 h post-OGT deletion). _O_-GlcNAc, OGT, _O_-GlcNAcase, HSP72, and Actin were determined in total cell lysates by immunoblot (IB) (n = 4).
FIGURE 5.
Modulating _O_-GlcNAc levels alters phosphorylation at Ser303. A, COS-7 cells were treated with 5 or 10 μ
m
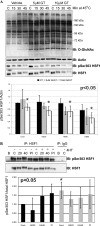
GlcNAc-thiazaline for 8 h. Cells were heat stressed at 45 °C for 20, 40, or 60 min. Expression of _O_-GlcNAc, Actin, HSF1, and Ser(P)303 HSF1 was determined in total cell lysates by immunoblot (n = 3). Densitometry representing the ratio of Ser(P)303 HSF1/Actin is reported for three experiments. p values are derived from a two-way analysis of variance comparing Ser(P)303 HSF1 phosphorylation between OGT wild-type and null cells. Error bars represent 1 standard deviation. An asterisk represents a _p_-value <0.05. B, HSF1 was immunoprecipitated from OGT wild-type and null cells (38h post-OGT deletion). Ser(P)303 HSF1 was determined on HSF1 immunoprecipitates (IP) by immunoblot (IB) with anti-Ser(P)303 HSF1 (n = 6). PI denotes cells treated with Calyculin A. Densitometry was performed as above, OGT wild-type cells are represented by black bars and OGT null cells in gray bars.
FIGURE 6.
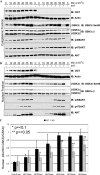
Stress induced inactivation of GSK-3β is defective in the OGT knockout. OGT wild-type and null cells (38 h post-OGT deletion) were heat stressed (45 °C) and harvested every 10 min. The last time point was harvested 39 h post-OGT deletion. GSK-3β, Ser(P)9 GSK-3β, OGT, Total AKT/PKB, p308 AKT/PKB, p473 AKT/PKB, and Actin were detected in cytoplasmic fractions (A) or nuclear fractions (B) by immunoblot (IB). The quality of the cytoplasmic and nuclear fractions was assessed by immunoblotting for Lamin and Tubulin (n = 3). C, densitometry representing the ratio of Ser(P)9 GSK-3 β/total GSK-3β in nuclear fractions is reported for three experiments. p values are derived from a Student's t test (Paired, two-tailed) comparing Ser(P)9 GSK-3 β phosphorylation between OGT wild-type and null cells. Error bars represent 1 standard deviation. An asterisk represents a _p_-value <0.1, a double asterisk represents a _p_-value of <0.05.
FIGURE 7.
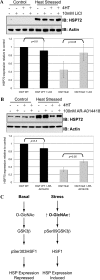
Inhibition of GSK-3β recovers expression of HSP72 in the OGT null. OGT wild-type and null cells (38 h post-OGT deletion) were pre-treated (1 h) with GSK-3β inhibitors LiCl2 (10 m
m
) (A) or AR-A014418 (100 n
m
) (B). Cells were stressed (45 °C, 60 min; 39 h post-OGT deletion) and recovered at 37 °C (2 h; 41 h post-OGT deletion)). HSP72 and Actin were detected in whole cell lysate by immunoblot (IB) (n = 3). Densitometry representing HSP72 expression in heat-stressed cells is reported. Densitometry from OGT null cells is depicted in gray. C, model of the mechanism by which _O_-GlcNAc regulates HSP expression. Error bars represent one standard deviation.
Similar articles
- Role of O-linked N-acetylglucosamine modification in diabetic nephropathy.
Gellai R, Hodrea J, Lenart L, Hosszu A, Koszegi S, Balogh D, Ver A, Banki NF, Fulop N, Molnar A, Wagner L, Vannay A, Szabo AJ, Fekete A. Gellai R, et al. Am J Physiol Renal Physiol. 2016 Dec 1;311(6):F1172-F1181. doi: 10.1152/ajprenal.00545.2015. Epub 2016 Mar 30. Am J Physiol Renal Physiol. 2016. PMID: 27029430 - Dynamic interplay between O-linked N-acetylglucosaminylation and glycogen synthase kinase-3-dependent phosphorylation.
Wang Z, Pandey A, Hart GW. Wang Z, et al. Mol Cell Proteomics. 2007 Aug;6(8):1365-79. doi: 10.1074/mcp.M600453-MCP200. Epub 2007 May 16. Mol Cell Proteomics. 2007. PMID: 17507370 - _O_-GlcNAcylation-induced GSK-3β activation deteriorates pressure overload-induced heart failure via lack of compensatory cardiac hypertrophy in mice.
Matsuno M, Yokoe S, Nagatsuka T, Morihara H, Moriwaki K, Asahi M. Matsuno M, et al. Front Endocrinol (Lausanne). 2023 Mar 22;14:1122125. doi: 10.3389/fendo.2023.1122125. eCollection 2023. Front Endocrinol (Lausanne). 2023. PMID: 37033243 Free PMC article. - O-GlcNAc a sensor of cellular state: the role of nucleocytoplasmic glycosylation in modulating cellular function in response to nutrition and stress.
Zachara NE, Hart GW. Zachara NE, et al. Biochim Biophys Acta. 2004 Jul 6;1673(1-2):13-28. doi: 10.1016/j.bbagen.2004.03.016. Biochim Biophys Acta. 2004. PMID: 15238246 Review. - Nucleocytoplasmic O-glycosylation: O-GlcNAc and functional proteomics.
Vosseller K, Wells L, Hart GW. Vosseller K, et al. Biochimie. 2001 Jul;83(7):575-81. doi: 10.1016/s0300-9084(01)01295-0. Biochimie. 2001. PMID: 11522385 Review.
Cited by
- Nutrient-sensitive protein O-GlcNAcylation shapes daily biological rhythms.
Liu X, Chiu JC. Liu X, et al. Open Biol. 2022 Sep;12(9):220215. doi: 10.1098/rsob.220215. Epub 2022 Sep 14. Open Biol. 2022. PMID: 36099933 Free PMC article. Review. - O-GlcNAc transferase maintains metabolic homeostasis in response to CDK9 inhibition.
Gondane A, Poulose N, Walker S, Mills IG, Itkonen HM. Gondane A, et al. Glycobiology. 2022 Aug 18;32(9):751-759. doi: 10.1093/glycob/cwac038. Glycobiology. 2022. PMID: 35708495 Free PMC article. - Effects of hypo-_O_-GlcNAcylation on Drosophila development.
Mariappa D, Ferenbach AT, van Aalten DMF. Mariappa D, et al. J Biol Chem. 2018 May 11;293(19):7209-7221. doi: 10.1074/jbc.RA118.002580. Epub 2018 Mar 27. J Biol Chem. 2018. PMID: 29588363 Free PMC article. - Cancer metabolism and elevated O-GlcNAc in oncogenic signaling.
Ma Z, Vosseller K. Ma Z, et al. J Biol Chem. 2014 Dec 12;289(50):34457-65. doi: 10.1074/jbc.R114.577718. Epub 2014 Oct 21. J Biol Chem. 2014. PMID: 25336642 Free PMC article. Review. - Quantitative phosphoproteomics reveals crosstalk between phosphorylation and O-GlcNAc in the DNA damage response pathway.
Zhong J, Martinez M, Sengupta S, Lee A, Wu X, Chaerkady R, Chatterjee A, O'Meally RN, Cole RN, Pandey A, Zachara NE. Zhong J, et al. Proteomics. 2015 Jan;15(2-3):591-607. doi: 10.1002/pmic.201400339. Proteomics. 2015. PMID: 25263469 Free PMC article.
References
- Zachara N. E., Hart G. W. (2006) Biochim. Biophys. Acta 1761, 599–617 - PubMed
- Zachara N. E., Hart G. W. (2004) Trends Cell Biol. 14, 218–221 - PubMed
- Hanover J. A., Yu S., Lubas W. B., Shin S. H., Ragano-Caracciola M., Kochran J., Love D. C. (2003) Arch. Biochem. Biophys. 409, 287–297 - PubMed
- Love D. C., Kochan J., Cathey R. L., Shin S. H., Hanover J. A., Kochran J. (2003) J. Cell Sci. 116, 647–654 - PubMed
Publication types
MeSH terms
Substances
LinkOut - more resources
Full Text Sources
Other Literature Sources
Molecular Biology Databases
Miscellaneous


