Supervised classification of microbiota mitigates mislabeling errors - PubMed (original) (raw)
Supervised classification of microbiota mitigates mislabeling errors
Dan Knights et al. ISME J. 2011 Apr.
No abstract available
Figures
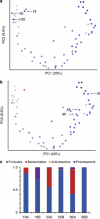
Figure 1
Resequenced 454 16S rRNA genes from infant time series experiment. These data are 60 fecal samples obtained over 2.5 years from a single individual. (a) Principal coordinates analysis of unweighted UniFrac distances derived from sequences from the initial sequencing run. (b) Corrected data. (c) Taxonomic discrepancies between the initial run (a) and the corrected run (b). Sample points are colored according to collection time where dark blue points represent time points that were collected early during the experiment, whereas the light gray time points represent later samples. Note that time points from days 19, 55 and 85 are misplaced in panel a (too dark for their position), and after resequencing, they cluster with other dark blue samples (early time points).
Figure 2
(a, b) Metadata error correction using random forests for the forensic identification task (a) and the general body habitat classification task (b). The horizontal axes show the proportion of labels that has been intentionally perturbed, and the vertical axes show the proportion of error in the prediction of the random forest classifier when trained on the full dataset with the perturbed labels. Each point represents the average error for 10 random perturbations of the metadata, with standard error bars. The solid black line simply shows the amount of error in the metadata, and is a useful reference for the other curves. The ‘Classifier's reported error' reflects how well the model ‘thinks' it is doing based on the partially incorrect metadata, whereas the ‘Classifier's true error‘ reflects a ‘god's-eye view' of how well the model is actually doing based on the true metadata. If the model does a good job of learning the differences between categories, it will often discover the true category for a mislabeled sample, although it will still report such a classification as an error. Hence the true error is generally lower than the reported error. (c, d) Principal coordinates analysis plots of the UniFrac distances between samples in the Fierer et al. (2010) dataset; the first two axes (shown) explain 18.0 and 6.3% of the total variation. Panel c Shows the data with 40 randomly chosen intentionally confused labels circled in red, and d shows the labels predicted by the random forest classifier (trained with 2000 trees and otherwise default settings using the confused labels). This classifier recovered all of the true class labels for those samples, while introducing only two new incorrect labels. Confused labels that were corrected by the model are indicated with a black square; remaining errors are indicated with a red circle.
Similar articles
- Comparison of reduced metagenome and 16S rRNA gene sequencing for determination of genetic diversity and mother-child overlap of the gut associated microbiota.
Ravi A, Avershina E, Angell IL, Ludvigsen J, Manohar P, Padmanaban S, Nachimuthu R, Snipen L, Rudi K. Ravi A, et al. J Microbiol Methods. 2018 Jun;149:44-52. doi: 10.1016/j.mimet.2018.02.016. Epub 2018 Mar 1. J Microbiol Methods. 2018. PMID: 29501688 - Practical innovations for high-throughput amplicon sequencing.
Lundberg DS, Yourstone S, Mieczkowski P, Jones CD, Dangl JL. Lundberg DS, et al. Nat Methods. 2013 Oct;10(10):999-1002. doi: 10.1038/nmeth.2634. Epub 2013 Sep 1. Nat Methods. 2013. PMID: 23995388 - First microbiota assessments of children's paddling pool waters evaluated using 16S rRNA gene-based metagenome analysis.
Sawabe T, Suda W, Ohshima K, Hattori M, Sawabe T. Sawabe T, et al. J Infect Public Health. 2016 May-Jun;9(3):362-5. doi: 10.1016/j.jiph.2015.11.008. Epub 2015 Dec 3. J Infect Public Health. 2016. PMID: 26671497 - Metagenomics of human microbiome: beyond 16s rDNA.
Gosalbes MJ, Abellan JJ, Durbán A, Pérez-Cobas AE, Latorre A, Moya A. Gosalbes MJ, et al. Clin Microbiol Infect. 2012 Jul;18 Suppl 4:47-9. doi: 10.1111/j.1469-0691.2012.03865.x. Clin Microbiol Infect. 2012. PMID: 22647049 Review. - Organism and Microbiome Analysis: Techniques and Implications for Chronic Rhinosinusitis.
Halderman AA, Lane AP. Halderman AA, et al. Otolaryngol Clin North Am. 2017 Jun;50(3):521-532. doi: 10.1016/j.otc.2017.01.004. Epub 2017 Mar 16. Otolaryngol Clin North Am. 2017. PMID: 28318535 Review.
Cited by
- Artificial intelligence-driven microbiome data analysis for estimation of postmortem interval and crime location.
Wu Z, Guo Y, Hayakawa M, Yang W, Lu Y, Ma J, Li L, Li C, Liu Y, Niu J. Wu Z, et al. Front Microbiol. 2024 Jan 19;15:1334703. doi: 10.3389/fmicb.2024.1334703. eCollection 2024. Front Microbiol. 2024. PMID: 38314433 Free PMC article. Review. - Paneth cell defects in Crohn's disease patients promote dysbiosis.
Liu TC, Gurram B, Baldridge MT, Head R, Lam V, Luo C, Cao Y, Simpson P, Hayward M, Holtz ML, Bousounis P, Noe J, Lerner D, Cabrera J, Biank V, Stephens M, Huttenhower C, McGovern DP, Xavier RJ, Stappenbeck TS, Salzman NH. Liu TC, et al. JCI Insight. 2016 Jun 2;1(8):e86907. doi: 10.1172/jci.insight.86907. JCI Insight. 2016. PMID: 27699268 Free PMC article. - Microbial co-occurrence relationships in the human microbiome.
Faust K, Sathirapongsasuti JF, Izard J, Segata N, Gevers D, Raes J, Huttenhower C. Faust K, et al. PLoS Comput Biol. 2012;8(7):e1002606. doi: 10.1371/journal.pcbi.1002606. Epub 2012 Jul 12. PLoS Comput Biol. 2012. PMID: 22807668 Free PMC article. - Parallel Mapping of Antibiotic Resistance Alleles in Escherichia coli.
Weiss SJ, Mansell TJ, Mortazavi P, Knight R, Gill RT. Weiss SJ, et al. PLoS One. 2016 Jan 15;11(1):e0146916. doi: 10.1371/journal.pone.0146916. eCollection 2016. PLoS One. 2016. PMID: 26771672 Free PMC article. - Adhesive Bacteria in the Terminal Ileum of Children Correlates With Increasing Th17 Cell Activation.
Chen B, Ye D, Luo L, Liu W, Peng K, Shu X, Gu W, Wang X, Xiang C, Jiang M. Chen B, et al. Front Pharmacol. 2020 Nov 30;11:588560. doi: 10.3389/fphar.2020.588560. eCollection 2020. Front Pharmacol. 2020. PMID: 33390964 Free PMC article.
References
- Breiman L. Random forests. Machine Learning. 2001;45:5–32.
- Hugenholtz P, Tyson GW. Microbiology: metagenomics. Nature. 2008;455:481–483. - PubMed
Publication types
MeSH terms
Substances
LinkOut - more resources
Full Text Sources
Other Literature Sources

