Tissue inhibitor of metalloproteinase-3 (TIMP-3) regulates hematopoiesis and bone formation in vivo - PubMed (original) (raw)
Tissue inhibitor of metalloproteinase-3 (TIMP-3) regulates hematopoiesis and bone formation in vivo
Yi Shen et al. PLoS One. 2010.
Abstract
Background: Tissue inhibitor of metalloproteinases-3 (TIMP-3) inhibits matrix metalloproteinases and membrane-bound sheddases. TIMP-3 is associated with the extracellular matrix and is expressed in highly remodeling tissues. TIMP-3 function in the hematopoietic system is unknown.
Methodology/principal findings: We now report that TIMP-3 is highly expressed in the endosteal region of the bone marrow (BM), particularly by osteoblasts, endothelial and multipotent mesenchymal stromal cells which are all important cellular components of hematopoietic stem cell (HSC) niches, whereas its expression is very low in mature leukocytes and hematopoietic stem and progenitor cells. A possible role of TIMP-3 as an important niche component was further suggested by its down-regulation during granulocyte colony-stimulating factor-induced mobilization. To further investigate TIMP-3 function, mouse HSC were retrovirally transduced with human TIMP-3 and transplanted into lethally irradiated recipients. TIMP-3 overexpression resulted in decreased frequency of B and T lymphocytes and increased frequency of myeloid cells in blood and BM, increased Lineage-negative Sca-1(+)KIT(+) cell proliferation in vivo and in vitro and increased colony-forming cell trafficking to blood and spleen. Finally, over-expression of human TIMP-3 caused a late onset fatal osteosclerosis.
Conclusions/significance: Our results suggest that TIMP-3 regulates HSC proliferation, differentiation and trafficking in vivo, as well as bone and bone turn-over, and that TIMP-3 is expressed by stromal cells forming HSC niches within the BM. Thus, TIMP-3 may be an important HSC niche component regulating both hematopoiesis and bone remodeling.
Conflict of interest statement
Competing Interests: The authors have declared that no competing interests exist.
Figures
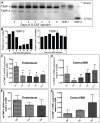
Figure 1. Decreased TIMP-3 expression level during G-CSF induced mobilization.
(A) Detection by reverse zymography of TIMP-1 and TIMP-3 proteins from mouse BM fluids following mobilization with G-CSF. G-CSF was administered twice daily from day 0 to day 6 and the left to rest for 2 days (day 8 group). Each sample is a pool of BM fluids from 4 mice per time point. Controls were made with recombinant human TIMP-1 (0.1 and 0.3 ng) and TIMP-2 (1 ng). (B) Quantification of TIMP-3 and TIMP-1 protein concentrations during G-CSF induced mobilization from panel A. (C–D) TIMP-3 mRNA expression by RT-qPCR in cells from the endosteal region (C) and central BM (D). Data are normalized to B2M expression and are average ± SD of at least 4 mice per time-point. * indicates a p value of 0.03 compared to control mice. (E–F) TIMP-1 mRNA expression in endosteal (E) and central BM (F).
Figure 2. TIMP-3 expression pattern in the BM.
(A) Comparison of TIMP-3 mRNA expression between endosteal and central BM cells by RT-qPCR. Data are mean ± SD of at least 7 mice per group normalized to B2M. (B) TIMP-3 mRNA in cells sorted from collagenase-treated compact bones or central bones. Phenotypes used are described in Supplementary Materials and Methods. Data are mean ± SD of at least 3 mice per group normalized to B2M. (C) TIMP-3 immunohistofluorescence by confocal laser scanning microscopy on bone sections x40 magnification. Two left panels are with rabbit anti-TIMP-3 antibody, two right panel with control non-immune rabbit IgG. Green color shows anti-TIMP-3 fluorescence whereas the pink color shows nuclei stained by DAPI. Osteoblasts (OB), endothelial cells (endo) and megakayocytes (MK) are indicated. (D) Reverse zymography of mouse blood plasma, sera and platelet lysates. Glycosylated and unglycosylated TIMP-3, and TIMP-2 are indicated. M lane contains molecular weight markers, + lane contains 20 ng of rmuTIMP-3.
Figure 3. Retroviral vector to over-express huTIMP-3 in murine hematopoietic cells.
(A) Representation of the MXIE retroviral vector containing huTIMP-3, an IRES, and GFP thus allowing for the co-expression of huTIMP-3 and GFP. (B) PCR and (C) RT-PCR of genomic DNA and RNA respectively from retrovirally transduced mouse hematopoietic cell line. M is markers, Mock are non-transduced cells, MXIE are cells transduced with empty-MXIE vector and MXIE-huTIMP-3 are cells transduced with the MXIE-huTIMP3 vector. + lane is the original plasmid containing huTIMP-3 cDNA as positive control. (D) Reverse zymography of culture supernatants from different clones of FDCP1 cells transduced with empty MXIE or MXIE-huTIMP-3 vectors. M is molecular weight markers, and + is 25 ng rhuTIMP-3.
Figure 4. Flow cytometry analysis of leukocytes in mice over-expressing huTIMP-3 in hematopoietic cells
. Frequency of CD11b+ myeloid cells (A), B220+ B cells (B) and CD3+ T cells (C) among GFP+ transduced cells in the BM, blood and spleen of mice reconstituted with HSC transduced with empty MXIE vector (white columns) or MXIE-huTIMP3 vector (black column). Data are mean ± SD of 9 mice per group. (D) Proportion of CD11b+ myeloid cells, B220+ B cells and CD3+ T cells in the BM, spleen and blood of the same mice when GFP expression was not taken into consideration. Data are mean ± SD of 9 mice per group. (E) Reverse zymography of BM fluids from mice transplanted with HSC transduced with empty MXIE vector or MXIE-huTIMP3 (n = 5 per group). M is molecular weight marker, + is 25 ng of rhuTIMP-3. (F) Quantification of the integrated intensity of TIMP-3 bands from panel E.
Figure 5. Increased CFC trafficking in mice over-expressing huTIMP-3.
Colony-forming cell number in spleen (A), blood (B) and femoral BM (C) from mice transplanted with HSC transduced with empty MXIE vector (white columns) or MXIE-huTIMP3 vector (black columns). Data are mean ± SD of 9 mice per group.
Figure 6. huTIMP-3 increases LSK cell proliferation in vivo and in vitro.
(A) Proportion of transduced LSK cells that incorporated BrdU in vivo after 3 day BrdU administration. Data are mean ± SD of 5 mice per group. (B) In vitro proliferation of transduced LSK cells after 12 days of culture. LSK cells were seeded at 4,000/mL. Data are average ± SD of triplicates. (C) Day 7 effect of the addition of 200 ng/mL purified rhuTIMP-3 to liquid culture of LSK cells from non-manipulated mice. Data are mean ± SEM of 2 mice in quadruplicates.
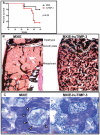
Figure 7. Long-term over-expression of huTIMP-3 in hematopoietic cells leads to fatal osteosclerosis.
(A) Survival curve of mice transplanted with HSC transduced with empty MXIE vector or MXIE-huTIMP3 vector (n = 10 in each group). (B) von Kossa staining and toluidine blue staining (C) of tibial sections from mice transplanted with HSC transduced with empty MXIE vector or MXIE-huTIMP3 vector. In panel B, black staining shows calcified bone. In panel C, cuboidal osteoblasts covering the osteoid are indicated by empty arrow heads. Note that osteoblasts and osteoid are absent in mice transduced with MXIE-huTIMP3.
Similar articles
- TIMP-3 recruits quiescent hematopoietic stem cells into active cell cycle and expands multipotent progenitor pool.
Nakajima H, Ito M, Smookler DS, Shibata F, Fukuchi Y, Morikawa Y, Ikeda Y, Arai F, Suda T, Khokha R, Kitamura T. Nakajima H, et al. Blood. 2010 Nov 25;116(22):4474-82. doi: 10.1182/blood-2010-01-266528. Epub 2010 Aug 26. Blood. 2010. PMID: 20798233 - Molecular signature and in vivo behavior of bone marrow endosteal and subendosteal stromal cell populations and their relevance to hematopoiesis.
Balduino A, Mello-Coelho V, Wang Z, Taichman RS, Krebsbach PH, Weeraratna AT, Becker KG, de Mello W, Taub DD, Borojevic R. Balduino A, et al. Exp Cell Res. 2012 Nov 15;318(19):2427-37. doi: 10.1016/j.yexcr.2012.07.009. Epub 2012 Jul 27. Exp Cell Res. 2012. PMID: 22841688 Free PMC article. - Stable colony-stimulating factor 1 fusion protein treatment increases hematopoietic stem cell pool and enhances their mobilisation in mice.
Kaur S, Sehgal A, Wu AC, Millard SM, Batoon L, Sandrock CJ, Ferrari-Cestari M, Levesque JP, Hume DA, Raggatt LJ, Pettit AR. Kaur S, et al. J Hematol Oncol. 2021 Jan 6;14(1):3. doi: 10.1186/s13045-020-00997-w. J Hematol Oncol. 2021. PMID: 33402221 Free PMC article. - Regulation of hematopoiesis in endosteal microenvironments.
Asada N, Katayama Y. Asada N, et al. Int J Hematol. 2014 Jun;99(6):679-84. doi: 10.1007/s12185-014-1583-1. Epub 2014 Apr 24. Int J Hematol. 2014. PMID: 24760425 Review. - Extravascular coagulation in hematopoietic stem and progenitor cell regulation.
Nguyen TS, Lapidot T, Ruf W. Nguyen TS, et al. Blood. 2018 Jul 12;132(2):123-131. doi: 10.1182/blood-2017-12-768986. Epub 2018 Jun 4. Blood. 2018. PMID: 29866813 Free PMC article. Review.
Cited by
- Perivascular-like cells contribute to the stability of the vascular network of osteogenic tissue formed from cell sheet-based constructs.
Mendes LF, Pirraco RP, Szymczyk W, Frias AM, Santos TC, Reis RL, Marques AP. Mendes LF, et al. PLoS One. 2012;7(7):e41051. doi: 10.1371/journal.pone.0041051. Epub 2012 Jul 19. PLoS One. 2012. PMID: 22829909 Free PMC article. - Engineering a multicellular vascular niche to model hematopoietic cell trafficking.
Kotha SS, Hayes BJ, Phong KT, Redd MA, Bomsztyk K, Ramakrishnan A, Torok-Storb B, Zheng Y. Kotha SS, et al. Stem Cell Res Ther. 2018 Mar 23;9(1):77. doi: 10.1186/s13287-018-0808-2. Stem Cell Res Ther. 2018. PMID: 29566751 Free PMC article. - Mesenchymal Stromal Cells from the Maternal Segment of Human Umbilical Cord is Ideal for Bone Regeneration in Allogenic Setting.
Lim J, Razi ZRM, Law JX, Nawi AM, Idrus RBH, Chin TG, Mustangin M, Ng MH. Lim J, et al. Tissue Eng Regen Med. 2017 Oct 25;15(1):75-87. doi: 10.1007/s13770-017-0086-6. eCollection 2018 Feb. Tissue Eng Regen Med. 2017. PMID: 30603536 Free PMC article. - Overexpression of TIMP-3 in Chondrocytes Produces Transient Reduction in Growth Plate Length but Permanently Reduces Adult Bone Quality and Quantity.
Poulet B, Liu K, Plumb D, Vo P, Shah M, Staines K, Sampson A, Nakamura H, Nagase H, Carriero A, Shefelbine S, Pitsillides AA, Bou-Gharios G. Poulet B, et al. PLoS One. 2016 Dec 21;11(12):e0167971. doi: 10.1371/journal.pone.0167971. eCollection 2016. PLoS One. 2016. PMID: 28002442 Free PMC article. - Role of stem cell factor and granulocyte colony-stimulating factor in remodeling during liver regeneration.
Meng F, Francis H, Glaser S, Han Y, DeMorrow S, Stokes A, Staloch D, Venter J, White M, Ueno Y, Reid LM, Alpini G. Meng F, et al. Hepatology. 2012 Jan;55(1):209-21. doi: 10.1002/hep.24673. Hepatology. 2012. PMID: 21932404 Free PMC article.
References
- Nilsson SK, Johnston HM, Coverdale JA. Spatial localization of transplanted hemopoietic stem cells: inferences for the localization of stem cell niches. Blood. 2001;97:2293–2299. - PubMed
- Xie Y, Yin T, Wiegraebe W, He XC, Miller D, et al. Detection of functional haematopoietic stem cell niche using real-time imaging. Nature. 2009;457:97–101. - PubMed
- Nakamura Y, Arai F, Iwasaki H, Hosokawa K, Kobayashi I, et al. Isolation and characterization of endosteal niche cell populations that regulate hematopoietic stem cells. Blood 2010 - PubMed
Publication types
MeSH terms
Substances
LinkOut - more resources
Full Text Sources
Other Literature Sources
Medical
Research Materials
Miscellaneous


