Epigenetic antagonism between polycomb and SWI/SNF complexes during oncogenic transformation - PubMed (original) (raw)
Epigenetic antagonism between polycomb and SWI/SNF complexes during oncogenic transformation
Boris G Wilson et al. Cancer Cell. 2010.
Erratum in
- Cancer Cell. 2011 Jan 18;19(1):153
Abstract
Epigenetic alterations have been increasingly implicated in oncogenesis. Analysis of Drosophila mutants suggests that Polycomb and SWI/SNF complexes can serve antagonistic developmental roles. However, the relevance of this relationship to human disease is unclear. Here, we have investigated functional relationships between these epigenetic regulators in oncogenic transformation. Mechanistically, we show that loss of the SNF5 tumor suppressor leads to elevated expression of the Polycomb gene EZH2 and that Polycomb targets are broadly H3K27-trimethylated and repressed in SNF5-deficient fibroblasts and cancers. Further, we show antagonism between SNF5 and EZH2 in the regulation of stem cell-associated programs and that Snf5 loss activates those programs. Finally, using conditional mouse models, we show that inactivation of Ezh2 blocks tumor formation driven by Snf5 loss.
Copyright © 2010 Elsevier Inc. All rights reserved.
Figures
Figure 1
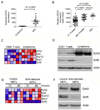
EZH2 is elevated in SNF5-deficient cancers and following Snf5 inactivation in primary cells. Scatter plot of EZH2 expression in (A) primary MRT compared to normal cerebellum and (B) in MRT compared to prostate tumors. (C) Heat map showing expression of PcG transcripts in murine Snf5-deficient CD8+ T-cell lymphoma cells compared to purified wild type CD8+ T-cells. Relative expression values are normalized across each row where red indicates high level expression and blue indicates low level expression. (D) Ezh2 protein levels are elevated in Snf5-deficient lymphomas. Immunoblot analysis of Ezh2 in CD8+ T-cells compared to Snf5-deficient CD8+ lymphoma T-cells. (E) Ezh2 mRNA levels are upregulated following Snf5 inactivation in MEFs. Heat map showing expression of PcG genes following Cre-mediated excision of Snf5 in MEFs compared to control MEFs. (F) Ezh2 protein levels are upregulated following Snf5 inactivation in MEFs. Immunoblot analysis of Ezh2 and Snf5 from whole cell extracts derived from control MEFs or Snf5-deficient MEFs. Actin is used as a loading control. See also Figure S1.
Figure 2
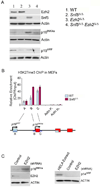
EZH2 and SNF5 have antagonistic roles in the control of expression of the model target p16INK4a. (A) Immunoblot analysis of p16INK4a and p19ARF after inactivation of Snf5 and Ezh2 in MEFs. Actin was used as a loading control. (B) ChIP analysis of H3K27me3 levels at the INK4a/ARF locus after Snf5 inactivation in MEFs. Primers were designed at the p19ARF and p16INK4a loci (primers A, B and C), as indicated in the schematic illustration in the bottom panel, and at several negative control regions (Actin promoter (Actin P.) and Actin intron (Actin In.). Data are represented as mean +/− SEM from 3 biological replicates. (C) Immunoblot analysis of p16INK4a and p14ARF after EZH2 knockdown in the G401 MRT cell line. Actin was used as a loading control. See also Figure S2.
Figure 3
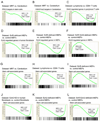
SNF5 loss leads to broad repression of PcG targets and activation of stem cell-associated programs. GSEA is a method that determines whether a set of genes shows differences between two biological states. The normalized enrichment score (NES) reflects the degree to which a gene set is upregulated (positive NES) or downregulated (negative NES). Corresponding p-values are indicated. (A)GSEA of PRC2 targets from stem cells (Ben-Porath et al., 2008) and (B) H3K27me3 enriched genes from cerebellum in expression data from human MRT samples compared to normal cerebellum. (C) GSEA of T-cell specific Ezh2-regulated genes (Su et al., 2005) in expression data from purified CD8+ Snf5-deficient lymphomas compared to CD8+ T-cells purified from a wild type mouse. (D) GSEA of human-fibroblast specific EZH2-regulated genes (Bracken et al., 2006) and (E) MEF-specific EZH2-regulated genes in expression data from Snf5-deficient MEFs compared to control MEFs. (F) GSEA of MEF-specific EZH2-regulated genes in expression data from Snf5 Ezh2-deficient MEFs compared to control MEFs. (G) GSEA of stem cell associated-program in expression data from human MRT samples compared to normal cerebellum, (H) purified CD8+ Snf5-deficient lymphomas compared to CD8+ T-cells purified from a wild type mouse, (I) Snf5-deficient MEFs compared to control MEFs, (J) human fibroblasts where EZH2 levels have been knocked down compared to control fibroblasts, (K) Ezh2-deficient MEFs compared to control MEFs, and (L) Snf5 Ezh2-deficient MEFs compared to control MEFs. The stem cell-associated expression signatures (Ben-Porath et al., 2008; Wong et al., 2008) and EZH2 knock down expression data (Bracken et al., 2006) were previously published. See also Figure S3. Gene sets are listed in Table S1.
Figure 4
Elevated levels of Ezh2 and H3K27me3 at PcG target genes following Snf5 loss. (A) ChIP analysis of H3K27me3 in Snf5-deficient lymphomas compared to wild type CD8+ T-cells. The experimental genes represent a random set of genes downregulated in Snf5-deficient lymphomas whereas the control genes are a random set expressed in both CD8+ T-cells and lymphomas. Relative enrichment is calculated by dividing the H3K27me3 enrichment to input DNA after normalization to a negative binding region in an Actb intron. Data are represented as mean +/− SEM from three biological replicates. * = p < 0.05. GSEA enrichment plot of H3K27me3 modified genes in wild type MEFs in expression data from (B) Ezh2-deficient MEFs, (C) Snf5-deficient MEFs or (D) Snf5 Ezh2-deficient MEFs. (E) GSEA enrichment plot of a random set of non-H3K27me3 genes in expression data from Snf5-deficient MEFs. (F) H3K27 ChIP-chip at individual gene promoters displayed using the Affymetrix Integrated Genome Browser. (G) H3K27me3 and Ezh2 ChIP-chip signal intensities near the transcription start sites (TSS) of 85 genes most significantly upregulated in Ezh2−/− MEFs and (H) 132 randomly chosen control repressed genes not altered in Snf5-deficient or Ezh2-deficient expression data. See also Figure S4.
Figure 5
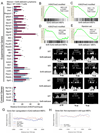
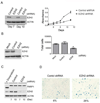
EZH2 is required for the proliferation of MRT cell lines. (A) Slowed proliferation of the G401 MRT cell line after EZH2 knockdown using shRNAs. Immunoblotting was used to determine the efficiency of EZH2 knockdown. Cell proliferation was determined using the WST-1 cell proliferation reagent. Data are represented as mean +/− SEM from 3 biological replicates. (B) Slowed proliferation of the G401 MRT cell line after EZH2 knockdown using siRNAs. Immunoblotting was used to determine the efficiency of EZH2 knockdown. Cells were counted 72 hours after treatment with the indicated siRNAs. Data are represented as mean +/− SEM from 3 biological replicates. *p = 0.01. (C) The reduced proliferation after shRNA mediated knockdown of EZH2 is not due to apoptosis. Apoptosis in EZH2 knockdown or control is measured via PARP1 cleavage. HeLa cells treated with doxyrubicin were used as a positive control for PARP1 cleavage. (D) EZH2 knockdown leads to cellular senescence. Cellular senescence was determined by measuring the expression of β-galactosidase. See also Figure S5.
Figure 6
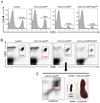
Ezh2 is dispensable for peripheral T-cell development. (A) The distribution of peripheral T-cells is unaffected by Ezh2 inactivation. Flow cytometry analysis of the CD3 T-cell marker on spleen cells isolated from mice of the indicated genotypes. (B) Flow cytometry analysis of CD8+ cells, the population from which Snf5-deficient lymphomas ultimately arise, in the spleen from mice of the indicated genotype. (C) An older CD4-Cre Snf5fl/fl mouse in which a lymphoma has developed showing the CD8+ lymphoma population on flow cytometry and gross images of spleens isolated from a wild type mouse (control) or lymphoma-bearing mouse.
Figure 7
Ezh2 is essential for in vivo tumor formation after conditional Snf5 inactivation. (A) Tumor-free survival curves of Snf5fl/fl CD4-Cre (n=8) and Snf5fl/fl Ezh2 fl/fl CD4-Cre (n=23) mice.
Figure 8
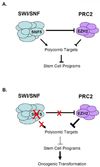
Model: Epigenetic antagonism between EZH2 and SNF5 during oncogenesis. (A) Antagonism of Polycomb target expression by SWI/SNF and PRC2. SNF5 also negatively regulates EZH2 function by modulating its expression. (B) Perturbations in SWI/SNF activity lead to oncogenesis via imbalanced PRC2 activity, aberrant epigenetic silencing of Polycomb targets and upregulation of stem cell-associated programs.
Similar articles
- Polycomb mediated epigenetic silencing and replication timing at the INK4a/ARF locus during senescence.
Agherbi H, Gaussmann-Wenger A, Verthuy C, Chasson L, Serrano M, Djabali M. Agherbi H, et al. PLoS One. 2009 May 20;4(5):e5622. doi: 10.1371/journal.pone.0005622. PLoS One. 2009. PMID: 19462008 Free PMC article. - SWI/SNF mediates polycomb eviction and epigenetic reprogramming of the INK4b-ARF-INK4a locus.
Kia SK, Gorski MM, Giannakopoulos S, Verrijzer CP. Kia SK, et al. Mol Cell Biol. 2008 May;28(10):3457-64. doi: 10.1128/MCB.02019-07. Epub 2008 Mar 10. Mol Cell Biol. 2008. PMID: 18332116 Free PMC article. - NSD1 mediates antagonism between SWI/SNF and polycomb complexes and is required for transcriptional activation upon EZH2 inhibition.
Drosos Y, Myers JA, Xu B, Mathias KM, Beane EC, Radko-Juettner S, Mobley RJ, Larsen ME, Piccioni F, Ma X, Low J, Hansen BS, Peters ST, Bhanu NV, Dhanda SK, Chen T, Upadhyaya SA, Pruett-Miller SM, Root DE, Garcia BA, Partridge JF, Roberts CWM. Drosos Y, et al. Mol Cell. 2022 Jul 7;82(13):2472-2489.e8. doi: 10.1016/j.molcel.2022.04.015. Epub 2022 May 9. Mol Cell. 2022. PMID: 35537449 Free PMC article. - Targeting EZH2 and PRC2 dependence as novel anticancer therapy.
Xu B, Konze KD, Jin J, Wang GG. Xu B, et al. Exp Hematol. 2015 Aug;43(8):698-712. doi: 10.1016/j.exphem.2015.05.001. Epub 2015 May 28. Exp Hematol. 2015. PMID: 26027790 Free PMC article. Review. - Epigenetics and cancer: altered chromatin remodeling via Snf5 loss leads to aberrant cell cycle regulation.
Sansam CG, Roberts CW. Sansam CG, et al. Cell Cycle. 2006 Mar;5(6):621-4. doi: 10.4161/cc.5.6.2579. Epub 2006 Mar 15. Cell Cycle. 2006. PMID: 16582616 Review.
Cited by
- Update from the 2011 International Schwannomatosis Workshop: From genetics to diagnostic criteria.
Plotkin SR, Blakeley JO, Evans DG, Hanemann CO, Hulsebos TJ, Hunter-Schaedle K, Kalpana GV, Korf B, Messiaen L, Papi L, Ratner N, Sherman LS, Smith MJ, Stemmer-Rachamimov AO, Vitte J, Giovannini M. Plotkin SR, et al. Am J Med Genet A. 2013 Mar;161A(3):405-16. doi: 10.1002/ajmg.a.35760. Epub 2013 Feb 7. Am J Med Genet A. 2013. PMID: 23401320 Free PMC article. - Integrated Molecular and Histological Insights for Targeted Therapies in Mesenchymal Sinonasal Tract Tumors.
Hoch CC, Knoedler L, Knoedler S, Bashiri Dezfouli A, Schmidl B, Trill A, Douglas JE, Adappa ND, Stögbauer F, Wollenberg B. Hoch CC, et al. Curr Oncol Rep. 2024 Mar;26(3):272-291. doi: 10.1007/s11912-024-01506-9. Epub 2024 Feb 20. Curr Oncol Rep. 2024. PMID: 38376625 Free PMC article. Review. - Treatment Strategies for ARID1A-Deficient Ovarian Clear Cell Carcinoma.
Takahashi K, Takenaka M, Okamoto A, Bowtell DDL, Kohno T. Takahashi K, et al. Cancers (Basel). 2021 Apr 7;13(8):1769. doi: 10.3390/cancers13081769. Cancers (Basel). 2021. PMID: 33917230 Free PMC article. Review. - KDM2B promotes pancreatic cancer via Polycomb-dependent and -independent transcriptional programs.
Tzatsos A, Paskaleva P, Ferrari F, Deshpande V, Stoykova S, Contino G, Wong KK, Lan F, Trojer P, Park PJ, Bardeesy N. Tzatsos A, et al. J Clin Invest. 2013 Feb;123(2):727-39. doi: 10.1172/JCI64535. Epub 2013 Jan 16. J Clin Invest. 2013. PMID: 23321669 Free PMC article. - Selective inhibition of Ezh2 by a small molecule inhibitor blocks tumor cells proliferation.
Qi W, Chan H, Teng L, Li L, Chuai S, Zhang R, Zeng J, Li M, Fan H, Lin Y, Gu J, Ardayfio O, Zhang JH, Yan X, Fang J, Mi Y, Zhang M, Zhou T, Feng G, Chen Z, Li G, Yang T, Zhao K, Liu X, Yu Z, Lu CX, Atadja P, Li E. Qi W, et al. Proc Natl Acad Sci U S A. 2012 Dec 26;109(52):21360-5. doi: 10.1073/pnas.1210371110. Epub 2012 Dec 10. Proc Natl Acad Sci U S A. 2012. PMID: 23236167 Free PMC article.
References
- Boyer LA, Plath K, Zeitlinger J, Brambrink T, Medeiros LA, Lee TI, Levine SS, Wernig M, Tajonar A, Ray MK, et al. Polycomb complexes repress developmental regulators in murine embryonic stem cells. Nature. 2006;441:349–353. - PubMed
- Bracken AP, Helin K. Polycomb group proteins: navigators of lineage pathways led astray in cancer. Nature reviews. 2009;9:773–784. - PubMed
Publication types
MeSH terms
Substances
Grants and funding
- DP1 CA174420/CA/NCI NIH HHS/United States
- U01 CA105423/CA/NCI NIH HHS/United States
- R01 CA113794/CA/NCI NIH HHS/United States
- 1 F32 CA130312-01A1/CA/NCI NIH HHS/United States
- R01CA113794/CA/NCI NIH HHS/United States
- F32 CA130312/CA/NCI NIH HHS/United States
- R01 CA109467/CA/NCI NIH HHS/United States
LinkOut - more resources
Full Text Sources
Other Literature Sources
Molecular Biology Databases
