Major differences in the responses of primary human leukocyte subsets to IFN-beta - PubMed (original) (raw)
Major differences in the responses of primary human leukocyte subsets to IFN-beta
Anette H H van Boxel-Dezaire et al. J Immunol. 2010.
Abstract
Treatment of cell lines with type I IFNs activates the formation of IFN-stimulated gene factor 3 (STAT1/STAT2/IFN regulatory factor-9), which induces the expression of many genes. To study this response in primary cells, we treated fresh human blood with IFN-β and used flow cytometry to analyze phosphorylated STAT1, STAT3, and STAT5 in CD4(+) and CD8(+) T cells, B cells, and monocytes. The activation of STAT1 was remarkably different among these leukocyte subsets. In contrast to monocytes and CD4(+) and CD8(+) T cells, few B cells activated STAT1 in response to IFN-β, a finding that could not be explained by decreased levels of IFNAR2 or STAT1 or enhanced levels of suppressor of cytokine signaling 1 or relevant protein tyrosine phosphatases in B cells. Microarray and real-time PCR analyses revealed the induction of STAT1-dependent proapoptotic mRNAs in monocytes but not in B cells. These data show that IFN-stimulated gene factor 3 or STAT1 homodimers are not the main activators of gene expression in primary B cells of healthy humans. Notably, in B cells and, especially in CD4(+) T cells, IFN-β activated STAT5 in addition to STAT3, with biological effects often opposite from those driven by activated STAT1. These data help to explain why IFN-β increases the survival of primary human B cells and CD4(+) T cells but enhances the apoptosis of monocytes, as well as to understand how leukocyte subsets are differentially affected by endogenous type I IFNs during viral or bacterial infections and by type I IFN treatment of patients with multiple sclerosis, hepatitis, or cancer.
Figures
FIGURE 1. Analysis of activation of STAT1 and STAT5 in human leukocytes
Undiluted whole blood from a healthy donor was stimulated with 500 IU/ml of IFN-β1a or was untreated for 45 min. After processing as described in Materials and Methods, the cells were analyzed by using flow cytometry. CD14+ (monocytes) and CD4+/CD3+ (CD4+ T cells) were determined within the live gate. The percentages of IFN-β-induced PY-STAT positive cells within each leukocyte subset was determined by subtracting the percentages of positive unstimulated cells, which were set at <2%.
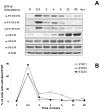
FIGURE 2. Flow cytometric and Western analyses of PY-STATs show the same pattern
The leukemic human B cell line HT was stimulated with 1000 IU/ml of IFN-β1a. Cells were either A, lysed and subjected to Western analysis or B, fixed and stained to determine the percentage of cells with PY-STATs by flow cytometry.
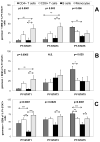
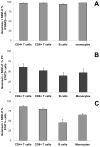
FIGURE 3. In vitro stimulation of whole blood with IFN-β reveals unique STAT activation patterns in different leukocyte subsets
Undiluted whole blood of healthy donors was left untreated or stimulated with either A, 500 IU/ml of IFN-β1a for 25 min (9 persons), B, 45 min (7 persons), or C, with 2000 of IU/ml IFN-β1a for 45 min (20 persons) and induction of PY-STATs 1, 3, and 5 was determined. The geometric means + SEM of the various donors are shown for percentages of leukocyte subsets positive for each PY-STAT. The Friedman test revealed significant differences in the activation of STATs among the four leukocyte subsets; the p values are shown in top of each Figure. The Friedman test was followed with post-hoc analysis, revealing significant differences in STAT1, 3 or 5 activation between the subsets, indicated in the figures by arrows. Significant differences were indicated as: * is p<0.05; ** is p<0.01; and *** is p<0.001. N.S. = not significantly different.
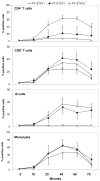
FIGURE 4. Activation of STATs in primary human blood cells after stimulation with IFN-β is optimal after 45 min
Undiluted whole blood from 3 healthy donors was unstimulated or stimulated with 500 IU/ml IFN-β1a for different time-periods. The geometric means + SEM of the 3 donors are shown for percentages of leukocyte subsets positive for each PY-STAT.
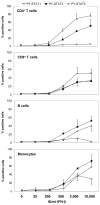
FIGURE 5. Dose responses for stimulation of PY-STATs with IFN-β in whole blood cell subsets
Undiluted whole blood of 3 healthy donors was unstimulated or stimulated with increasing concentrations of IFN-β1a for 45 min. PY-STATs 1, 3, and 5 were determined in leukocyte subsets as indicated. Geometric means + SEM of 3 healthy donors are shown for percentage PY-STAT-positive blood cells.
FIGURE 6. Differences in activation of STAT1 in leukocyte subsets are associated with variation in induction of apoptosis
A, Undiluted whole blood from four healthy donors was stimulated with 2000 IU/ml IFN-β or was unstimulated for varying times. Induction of activated caspase 3 in leukocyte subsets by IFN-β was determined by subtracting the percentage of caspase 3-positive cells in unstimulated cells from those in IFN-β-stimulated cells; results are shown for individual donors. B, Undiluted whole blood from five healthy donors was stimulated with 2000 IU/ml IFN-β or was not treated for 45 min. Geometric means + SD of 5 donors are shown for either PY-STAT1+/PY-STAT3−, PY-STAT1+/PY-STAT3+, PY-STAT1−/PY-STAT3+ or PY-STAT1+/PY-STAT5−, PY-STAT1+/PY-STAT5+, PY-STAT1−/PY-STAT5+ positive subsets. C, Data from four healthy individuals (data of fig. 6A and 6B combined) are depicted: induction of PY-STAT3−/PY-STAT1+-positive monocytes and CD8+ T cells after stimulation with IFN-β for 45 min correlated with caspase 3 activation after 8 and 4–10 h, respectively. For each leukocyte subset, R2, the coefficient of determination, and the P value (if significantly correlated) are shown.
FIGURE 7. Striking differences in gene-induction in purified B cells and monocytes after in vitro stimulation with IFN-β
Undiluted whole blood from 2 healthy donors was stimulated with 2000 IU/ml IFN-β1a or was unstimulated for 3 h. A, After 3 h, pure B cells and monocytes were isolated by using magnetically labeled antibodies. RNA isolated from the purified subsets was used for analysis of gene expression using micro-array. The fold-increase in mRNA was calculated comparing expression in unstim ulated with stimulated subsets. The Venn diagram shows increases in mRNA by at least 2-fold and illustrates different mRNA induction patterns in B cells (CD19) and monocytes (CD14). B, Differences in expression of apoptosis-inducing mRNAs (BAK1, CASP3, CDKN1A, STK3) and the survival-promoting mRNA PBEF1 between B cells and monocytes after stimulation with IFN-β, revealed by micro-array analysis (Table 1), was confirmed by real-time PCR, using mRNA isolated from purified monocytes and B cells, normalized relative to 18S rRNA. The median values of monocytes and B cells derived from 6 healthy subjects are shown for fold-changes in mRNA expression in stimulated compared to control subsets.
FIGURE 8. Differences in STAT1 activation cannot be explained by differences in IFNAR2 expression levels, STAT2 activation or STAT1 levels
A, Surface IFNAR2 expression was determined on monocytes, B cells, CD4+ T cells and CD8+ T cells present in unstimulated whole blood of six healthy individuals. B, Activation of STAT2 in leukocyte subsets was determined by stimulating undiluted whole blood of 6 healthy donors with 2000 IU/ml of IFN-β1a or unstimulated for 45 min. C, STAT1 expression was determined in monocytes, B cells, CD4+ T cells and CD8+ T cells present in unstimulated blood of four healthy subjects. Geometric means + SEM for the various donors are shown for the percentages of leukocyte subsets that are positive for surface IFNAR2 (A), PY-STAT2 (B), or intra-cellular STAT1 (C).
FIGURE 9. Similar activation of STAT1 in B cells after stimulation with IFN-γ, IFN-α1, IFN-α2b and IFN-β
Undiluted whole blood from six healthy subjects was stimulated for 30 min with 2000 IU/ml IFN-γ or for 45 min with 2000 IU/ml IFN-α1, IFN-α2b or IFN-β (optimal time-points for activation of STATs). Activation of STAT1 was determined in the various leukocyte subsets and shown for all six healthy subjects individually as percentages of PY-STAT1-positive subsets.
Similar articles
- The role of cell type-specific responses in IFN-β therapy of multiple sclerosis.
Zula JA, Green HC, Ransohoff RM, Rudick RA, Stark GR, van Boxel-Dezaire AH. Zula JA, et al. Proc Natl Acad Sci U S A. 2011 Dec 6;108(49):19689-94. doi: 10.1073/pnas.1117347108. Epub 2011 Nov 21. Proc Natl Acad Sci U S A. 2011. PMID: 22106296 Free PMC article. - Elevated STAT1 expression but not phosphorylation in lupus B cells correlates with disease activity and increased plasmablast susceptibility.
Aue A, Szelinski F, Weißenberg SY, Wiedemann A, Rose T, Lino AC, Dörner T. Aue A, et al. Rheumatology (Oxford). 2020 Nov 1;59(11):3435-3442. doi: 10.1093/rheumatology/keaa187. Rheumatology (Oxford). 2020. PMID: 32357246 - Multiparametric flow cytometric analysis of inter-patient variation in STAT1 phosphorylation following interferon Alfa immunotherapy.
Lesinski GB, Kondadasula SV, Crespin T, Shen L, Kendra K, Walker M, Carson WE 3rd. Lesinski GB, et al. J Natl Cancer Inst. 2004 Sep 1;96(17):1331-42. doi: 10.1093/jnci/djh252. J Natl Cancer Inst. 2004. PMID: 15339971 - A Positive Feedback Amplifier Circuit That Regulates Interferon (IFN)-Stimulated Gene Expression and Controls Type I and Type II IFN Responses.
Michalska A, Blaszczyk K, Wesoly J, Bluyssen HAR. Michalska A, et al. Front Immunol. 2018 May 28;9:1135. doi: 10.3389/fimmu.2018.01135. eCollection 2018. Front Immunol. 2018. PMID: 29892288 Free PMC article. Review. - Activation and regulation of interferon-β in immune responses.
Sin WX, Li P, Yeong JP, Chin KC. Sin WX, et al. Immunol Res. 2012 Sep;53(1-3):25-40. doi: 10.1007/s12026-012-8293-7. Immunol Res. 2012. PMID: 22411096 Review.
Cited by
- Elevated type I interferon-like activity in a subset of multiple sclerosis patients: molecular basis and clinical relevance.
Hundeshagen A, Hecker M, Paap BK, Angerstein C, Kandulski O, Fatum C, Hartmann C, Koczan D, Thiesen HJ, Zettl UK. Hundeshagen A, et al. J Neuroinflammation. 2012 Jun 22;9:140. doi: 10.1186/1742-2094-9-140. J Neuroinflammation. 2012. PMID: 22727118 Free PMC article. - Transient oscillatory dynamics of interferon beta signaling in macrophages.
Pertsovskaya I, Abad E, Domedel-Puig N, Garcia-Ojalvo J, Villoslada P. Pertsovskaya I, et al. BMC Syst Biol. 2013 Jul 9;7:59. doi: 10.1186/1752-0509-7-59. BMC Syst Biol. 2013. PMID: 23837526 Free PMC article. - Roles of Infection in Psoriasis.
Zhou S, Yao Z. Zhou S, et al. Int J Mol Sci. 2022 Jun 23;23(13):6955. doi: 10.3390/ijms23136955. Int J Mol Sci. 2022. PMID: 35805960 Free PMC article. Review. - Interferon impedes an early step of hepatitis delta virus infection.
Han Z, Nogusa S, Nicolas E, Balachandran S, Taylor J. Han Z, et al. PLoS One. 2011;6(7):e22415. doi: 10.1371/journal.pone.0022415. Epub 2011 Jul 19. PLoS One. 2011. PMID: 21811602 Free PMC article. - The functions of signal transducers and activators of transcriptions 1 and 3 as cytokine-inducible proteins.
Cheon H, Yang J, Stark GR. Cheon H, et al. J Interferon Cytokine Res. 2011 Jan;31(1):33-40. doi: 10.1089/jir.2010.0100. Epub 2010 Dec 19. J Interferon Cytokine Res. 2011. PMID: 21166594 Free PMC article. Review.
References
- Pestka S, Krause CD, Walter MR. Interferons, interferon-like cytokines, and their receptors. Immunol Rev. 2004;202:8–32. - PubMed
- Novick D, Cohen B, Rubinstein M. The human interferon alpha/beta receptor: characterization and molecular cloning. Cell. 1994;77:391–400. - PubMed
- Stark GR, I, Kerr M, Williams BR, Silverman RH, Schreiber RD. How cells respond to interferons. Annu Rev Biochem. 1998;67:227–264. - PubMed
- van Boxel-Dezaire AH, Rani MR, Stark GR. Complex modulation of cell type-specific signaling in response to type I interferons. Immunity. 2006;25:361–372. - PubMed
- Decker T, Kovarik P, Meinke A. GAS elements: a few nucleotides witha major impact on cytokine-induced gene expression. J Interferon Cytokine Res. 1997;17:121–134. - PubMed
Publication types
MeSH terms
Substances
Grants and funding
- P01 CA062220-14/CA/NCI NIH HHS/United States
- P30 CA043703/CA/NCI NIH HHS/United States
- P01 CA062220-13/CA/NCI NIH HHS/United States
- P01 CA06220/CA/NCI NIH HHS/United States
- P01 CA062220/CA/NCI NIH HHS/United States
- P01 CA062220-15/CA/NCI NIH HHS/United States
- P30 CA43703/CA/NCI NIH HHS/United States
LinkOut - more resources
Full Text Sources
Molecular Biology Databases
Research Materials
Miscellaneous

