β-Barrel topology of Alzheimer's β-amyloid ion channels - PubMed (original) (raw)
β-Barrel topology of Alzheimer's β-amyloid ion channels
Hyunbum Jang et al. J Mol Biol. 2010.
Abstract
Emerging evidence supports the ion channel mechanism for Alzheimer's disease pathophysiology wherein small β-amyloid (Aβ) oligomers insert into the cell membrane, forming toxic ion channels and destabilizing the cellular ionic homeostasis. Solid-state NMR-based data of amyloid oligomers in solution indicate that they consist of a double-layered β-sheets where each monomer folds into β-strand-turn-β-strand and the monomers are stacked atop each other. In the membrane, Aβ peptides are proposed to be β-type structures. Experimental structural data available from atomic force microscopy (AFM) imaging of Aβ oligomers in membranes reveal heterogeneous channel morphologies. Previously, we modeled the channels in a non-tilted organization, parallel with the cross-membrane normal. Here, we modeled a β-barrel-like organization. β-Barrels are common in transmembrane toxin pores, typically consisting of a monomeric chain forming a pore, organized in a single-layered β-sheet with antiparallel β-strands and a right-handed twist. Our explicit solvent molecular dynamics simulations of a range of channel sizes and polymorphic turns and comparisons of these with AFM image dimensions support a β-barrel channel organization. Different from the transmembrane β-barrels where the monomers are folded into a circular β-sheet with antiparallel β-strands stabilized by the connecting loops, these Aβ barrels consist of multimeric chains forming double β-sheets with parallel β-strands, where the strands of each monomer are connected by a turn. Although the Aβ barrels adopt the right-handed β-sheet twist, the barrels still break into heterogeneous, loosely attached subunits, in good agreement with AFM images and previous modeling. The subunits appear mobile, allowing unregulated, hence toxic, ion flux.
Copyright © 2010 Elsevier Ltd. All rights reserved.
Figures
Fig. 1.
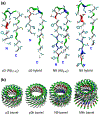
Truncated Aβ peptides with the U-shaped β-strand– turn–β-strand motif. (a) The p3 and N9 monomers extracted from two available experimentally based Aβ oligomer coordinate sets, and their hybrids, p3h (containing the N9 turn conformation) and N9h (containing the p3 turn conformation), are shown by the peptide backbone in a ribbon representation. (b) Conceptual design of annular structure for the 20-mer barrels with the CNpNC topology embedded in the lipid bilayers. In the peptide, hydrophobic residues are shown in white, polar and Gly residues are shown in green, positively charged residues are shown in blue, and negatively charged residues are shown in red. The cartoons are shown for the 20-mer barrels.
Fig. 2.
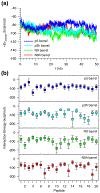
Interaction energies of truncated Aβ peptides with lipids. (a) Time series of averaged peptide interaction energy with DOPC lipids for the 20-mer p3 (blue line), p3h (cyan line), N9 (green line), and N9h (red line) barrels. (b) Interaction energies of each monomer in the 20-mer p3 (blue symbols), p3h (cyan symbols), N9 (green symbols), and N9h (red symbols) barrels averaged over time.
Fig. 3.
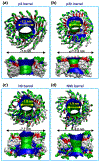
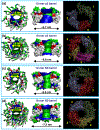
Heterogeneous barrel conformations in the lipid bilayer. Averaged pore structures calculated by the HOLE program embedded in the averaged barrel conformations during the simulations for the 20-mer p3 (a), p3h (b), N9 (c), and N9h (d) barrels. In the angle views of the pore structure (upper cartoons in each panel), whole barrel structures are shown with the ribbon representation with the same color representations described in the legend to Fig. 1. In the lateral views of the pore structure (lower cartoons in each panel), cross-sectioned barrels are given in the surface representation with the same color representations used in the legend to Fig. 1. For the pore structures in the surface representation, the degree of the pore diameter is indicated by the color codes in the order of redbgreenbblue, but the scale of these colors is relative to each barrel.
Fig. 4.
The calculated β-strand inclinations. The probability distributions of the β-strand tilt angle with respect to the bilayer normal are calculated separately for the N-terminal (dark gray area) and C-terminal (light gray area) β-strands in the 20-mer Aβ barrels.
Fig. 5.
The calculated interstrand distance. The effective β-strand distance, which is an inverse of the distance between two intermolecular Cα atoms of the same residues for the 20-mer p3 (a), p3h (b), N9 (c), and N9h (d) barrels. Gray circles and white triangles denote the effective β-strand distances for the inner N-terminal and outer C-terminal β-strands, respectively. The radial data set of the effective distance is in the scale of 0.25 Å−1. Angular intervals represent each peptide in the Aβ barrels as the number marked on the angular scale.
Fig. 6.
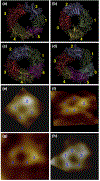
Side-by-side comparison between the computational barrels and the experimental channels. The simulated barrel structures with highlighted subunits for the 20-mer p3 (a), p3h (b), N9 (c), and N9h (d) barrels. The averaged barrels in the surface representation are shown in the view along the membrane normal. AFM images of p3 (e and f) and N9 (g and h) barrels show four or five subunits, consistent with the simulated barrels. Image sizes are 15 × 15 and 23×23 nm2, respectively (Jang et al.; permission was obtained.)
Fig. 7.
Possible smaller Aβ barrels in the lipid bilayer. Averaged pore structures calculated by the HOLE program embedded in the averaged barrel conformations during the simulations for the 12-mer p3 (a), 16-mer p3 (b), 12-mer N9 (c), and 16-mer N9 (d) barrels. In the angle views of the pore structure (left), whole barrel structures are shown with the ribbon representation with the same color representations described in the legend to Fig. 1. In the lateral views of the pore structure (center), cross-sectioned barrels are given in the surface representation with the same color representations used in the legend to Fig. 1. For the pore structures in the surface representation, the degree of the pore diameter is indicated by the color codes in the order of redbgreenbblue, but the scale of these colors is relative to each barrel. The simulated barrel structures (right) with highlighted subunits are shown in the view along the membrane normal.
Fig. 8.
The intensity of peptide interaction with lipid. The relative free energy surface for the peptide–lipid interaction as a function of the RMSD from the starting point for the 20-mer p3 (a), p3h (b), N9 (c), and N9h (d) barrels.
Fig. 9.
The ionic binding sites in the barrels. Three-dimensional density maps of Mg2+ (green mesh), K+ (red mesh), Ca2+ (blue mesh), Zn2+ (cyan mesh), and Cl− (gray mesh) for the 20-mer p3 (a) and N9 (b) barrels with three views. In the maps, the averaged barrel structures are shown as cartoons in gray. Probability distribution functions for Mg2+ (green line), K+ (red line), Ca2+ (blue line), Zn2+ (cyan line), and Cl− (black line) as a function of the pore axis are shown on the right corresponding to the cartoons on the left.
Fig. 10.
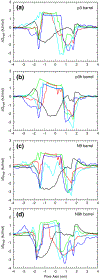
Ion-permeable Aβ barrels. PMF, Δ_G_PMF, calculated using the equation Δ_G_PMF=−k_B_T_ln(ρ_z/ρbulk) , where _k_B is the Boltzmann constant, T is the simulation temperature, ρz is the ion density at position z along the pore axis, and ρbulk is the ion density in the bulk region, representing the relative free energy profile for Mg2+ (green lines), K+ (red lines), Ca2+ (blue lines), Zn2+ (cyan lines), and Cl− (black lines) as a function of the distance along the pore center axis for the 20-mer p3 (a), p3h (b), N9 (c), and N9h (d) barrels.
Similar articles
- Misfolded amyloid ion channels present mobile beta-sheet subunits in contrast to conventional ion channels.
Jang H, Arce FT, Capone R, Ramachandran S, Lal R, Nussinov R. Jang H, et al. Biophys J. 2009 Dec 2;97(11):3029-37. doi: 10.1016/j.bpj.2009.09.014. Biophys J. 2009. PMID: 19948133 Free PMC article. - Models of beta-amyloid ion channels in the membrane suggest that channel formation in the bilayer is a dynamic process.
Jang H, Zheng J, Nussinov R. Jang H, et al. Biophys J. 2007 Sep 15;93(6):1938-49. doi: 10.1529/biophysj.107.110148. Epub 2007 May 25. Biophys J. 2007. PMID: 17526580 Free PMC article. - Interactions of Aβ25-35 β-barrel-like oligomers with anionic lipid bilayer and resulting membrane leakage: an all-atom molecular dynamics study.
Chang Z, Luo Y, Zhang Y, Wei G. Chang Z, et al. J Phys Chem B. 2011 Feb 10;115(5):1165-74. doi: 10.1021/jp107558e. Epub 2010 Dec 30. J Phys Chem B. 2011. PMID: 21192698 - Amyloid beta ion channel: 3D structure and relevance to amyloid channel paradigm.
Lal R, Lin H, Quist AP. Lal R, et al. Biochim Biophys Acta. 2007 Aug;1768(8):1966-75. doi: 10.1016/j.bbamem.2007.04.021. Epub 2007 May 3. Biochim Biophys Acta. 2007. PMID: 17553456 Free PMC article. Review. - Elucidating the Structures of Amyloid Oligomers with Macrocyclic β-Hairpin Peptides: Insights into Alzheimer's Disease and Other Amyloid Diseases.
Kreutzer AG, Nowick JS. Kreutzer AG, et al. Acc Chem Res. 2018 Mar 20;51(3):706-718. doi: 10.1021/acs.accounts.7b00554. Epub 2018 Mar 6. Acc Chem Res. 2018. PMID: 29508987 Free PMC article. Review.
Cited by
- Phosphatidylethanolamine enhances amyloid fiber-dependent membrane fragmentation.
Sciacca MF, Brender JR, Lee DK, Ramamoorthy A. Sciacca MF, et al. Biochemistry. 2012 Oct 2;51(39):7676-84. doi: 10.1021/bi3009888. Epub 2012 Sep 21. Biochemistry. 2012. PMID: 22970795 Free PMC article. - Atomic view of a toxic amyloid small oligomer.
Laganowsky A, Liu C, Sawaya MR, Whitelegge JP, Park J, Zhao M, Pensalfini A, Soriaga AB, Landau M, Teng PK, Cascio D, Glabe C, Eisenberg D. Laganowsky A, et al. Science. 2012 Mar 9;335(6073):1228-31. doi: 10.1126/science.1213151. Science. 2012. PMID: 22403391 Free PMC article. - Up-regulation of Alzheimer's disease-associated proteins may cause enflurane anesthesia induced cognitive decline in aged rats.
Liu H, Weng H. Liu H, et al. Neurol Sci. 2014 Feb;35(2):185-9. doi: 10.1007/s10072-013-1474-x. Epub 2013 Aug 11. Neurol Sci. 2014. PMID: 23934553 - Effect of metals on kinetic pathways of amyloid-β aggregation.
Hane F, Leonenko Z. Hane F, et al. Biomolecules. 2014 Jan 10;4(1):101-16. doi: 10.3390/biom4010101. Biomolecules. 2014. PMID: 24970207 Free PMC article. Review. - Aggregation and fibril morphology of the Arctic mutation of Alzheimer's Aβ peptide by CD, TEM, STEM and in situ AFM.
Norlin N, Hellberg M, Filippov A, Sousa AA, Gröbner G, Leapman RD, Almqvist N, Antzutkin ON. Norlin N, et al. J Struct Biol. 2012 Oct;180(1):174-89. doi: 10.1016/j.jsb.2012.06.010. Epub 2012 Jun 28. J Struct Biol. 2012. PMID: 22750418 Free PMC article.
References
- Wimley WC (2003). The versatile β-barrel membrane protein. Curr. Opin. Struct. Biol 13, 404–411. - PubMed
- Schulz GE (2002). The structure of bacterial outer membrane proteins. Biochim. Biophys. Acta, 1565, 308–317. - PubMed
- Jap BK & Walian PJ (1990). Biophysics of the structure and function of porins. Q. Rev. Biophys 23, 367–403. - PubMed
- Murzin AG, Lesk AM & Chothia C (1994). Principles determining the structure of beta-sheet barrels in proteins: I. A theoretical analysis. J. Mol. Biol 236, 1369–1381. - PubMed
Publication types
MeSH terms
Substances
LinkOut - more resources
Full Text Sources
Miscellaneous
