Antagonistic regulation of actin dynamics and cell motility by TRPC5 and TRPC6 channels - PubMed (original) (raw)
Antagonistic regulation of actin dynamics and cell motility by TRPC5 and TRPC6 channels
Dequan Tian et al. Sci Signal. 2010.
Erratum in
- Sci Signal. 2010;3(147):er11. Pavenstaedt, Hermann [corrected to Pavenstädt, Hermann]
Abstract
The Rho family of small guanosine triphosphatases (Rho GTPases: RhoA, Cdc42, and Rac1) regulates many aspects of cell behavior, including actin dynamics and cell migration. The generation of calcium ion (Ca(2+)) microdomains is critical in promoting cell migration because they control the localized activity of Rho GTPases. We identified receptor-activated TRPC5 and TRPC6 (transient receptor potential canonical type 5 and 6) channels as antagonistic regulators of actin remodeling and cell motility in fibroblasts and kidney podocytes. We show that TRPC5 is in a molecular complex with Rac1, whereas TRPC6 is in a molecular complex with RhoA. TRPC5-mediated Ca(2+) influx induces Rac1 activation, thereby promoting cell migration, whereas TRPC6-mediated Ca(2+) influx increases RhoA activity, thereby inhibiting cell migration. Our data unveil antagonistic Ca(2+) influx pathways as a conserved signaling mechanism for the integrated regulation of cell migration.
Conflict of interest statement
Competing interests: U.S. patent “TRPC5 channels in proteinuric kidney disease” pending (A.G.).
Figures
Fig. 1
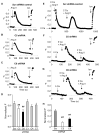
Ang II–evoked TRPC5 and TRPC6 activation contributes to intracellular Ca2+ transients in podocytes. Fluo-3 Ca2+ imaging in AT1R podocytes revealed Ca2+ transients in response to Ang II (500 nM) with (2 mM) or without Ca2+ (0 mM + 5 mM EGTA). Ionomycin(Ion)was added to the bath at the end of the experiment. (A to C) Normalized fluorescence amplitude in response to Ang II application (F) in podocytes expressing either scrambled (Scr) (A), C5 (B), or C6 shRNA (C). (D) Group data summary (mean ± SD). Gene silencing of TRPC5 (n = 34) and TRPC6 (n = 29), but not of TRPC1 (n = 15), TRPC4 (n = 26), or TRPC7 (n = 42), significantly decreased the amplitude of Ca2+ transient. (E to G) Representative traces in Ca2+ add-back experiments. A proportion of AT1R podocytes responded to a second application of Ang II within the 10-min recording period. (F) Gene silencing of TRPC5 (n = 5) or TRPC6 (n = 18) compared to Scr shRNA control (n = 16), significantly reduced Ca2+ influx in response to Ang II. (H) Group data in Scr controls, C5, and C6 knockdown cells (mean ± SE) (##P < 0.01).
Fig. 2
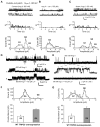
TRPC5- and TRPC6-like single-channel recordings in podocytes. (A to C) Upper panels: Single-channel current traces in the outside-out configuration in AT1R podocytes (_V_hold, −60 mV). At _V_step +100 mV, application of Ang II (500 nM) to the bath evoked single-channel openings (A). This single-channel activity was suppressed by 100 μM La3+ (B) in a reversible manner (C). The upper panel lower trace is the expansion of the black bar region in the upper trace. The middle panel shows frequency histograms of single-channel open probability _P_o (bin size, 0.1 s) under each condition. The lower panel is the single-channel amplitude frequency distribution histogram from which single-channel conductance was calculated from the fitted curve. The unitary conductances were (G1) 39 pS, (G2) 68 pS, (G3) 80 pS, and (G4) 33 pS. (D) Representative outside-out single-channel recording traces in AT1R podocytes overexpressing WT TRPC5. The upper panel shows a continuous outside-out patch recording at +100 mV. (1) 500 nM Ang II, (2) 500 nM Ang II + 100 μM La3+. Application of Ang II evoked TRPC5 channel openings (middle panel) enhanced by application of La3+ (lower panel). (E) Representative outside-out single-channel recordings from AT1R podocytes overexpressing WT TRPC6. Ang II evoked TRPC6 single-channel activity (upper and middle panels), suppressed by La3+ (lower panel). (F and G) Amplitude frequency distribution histograms (upper panel) and summary of single-channel conductances (lower panel) of TRPC5 (n = 8, mean ± SD) and TRPC6 patches (n = 9, mean ± SD), respectively. The single-channel conductance average was (G5) 37 pS, (G6) 74 pS (due to current summation of two TRPC5 channel openings), (G7) 35 pS, and (G8) 70 pS (due to summation of two TRPC6 channel openings).
Fig. 3
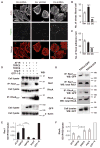
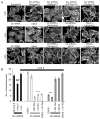
Ang II–induced TRPC5 and TRPC6 activation has antagonistic effects on the actin cytoskeleton. (A) TRPC6-depleted AT1R podocytes (C6 shRNA) showed loss of stress fibers after Ang II treatment. Paxillin staining was also reduced compared to scrambled shRNA controls (Scr shRNA). TRPC5-depleted AT1R podocytes (C5 shRNA) had increased stress fibers and paxillin-positive structures throughout the cytoplasm. Scale bar, 20 μm. (B) Quantification of stress fibers in AT1R cells. (C) TRPC6-depleted cells had significantly reduced focal contacts compared to Scr shRNA controls and TRPC5-depleted cells. (D to F) Functional coupling of TRPC5 to Rac1 and TRPC6 to RhoA. (D) GTPase activity assay in HEK293 cells. Ang II increased Rac1-GTP abundance in cells coexpressing TRPC5-GFP and AT1R (lane 2), but reduced Rac1-GTP in cells coexpressing TRPC6-GFP and AT1R (lane 3) (Rac1 and RhoA). Ang II treatment increased RhoA-GTP abundance in TRPC6/AT1R cells (lane 3), but reduced RhoA-GTP in TRPC5/AT1R cells (lane 2). Data are normalized to total cell lysate Rac1 and RhoA abundance (lanes 1 to 5). Guanosine 5′-_O_-(3′-thiotriphosphate) (GTP-γ-S)–loaded cells served as a positive control (lane 5). Non–AT1R-expressing HEK cells showed no Rac1 activity (lane 4). TRPC5-GFP and TRPC6-GFP expression was confirmed by blotting with antibody against GFP (lanes 2 and 3) (TRPC5-GFP and TRPC6-GFP). (E and F) Quantification of activity assays (one-way ANOVA, Newman-Keuls multiple comparison test, P < 0.001; n = 4 trials). (G) Coimmunoprecipitation experiments in HEK cells expressing TRPC5-GFP or TRPC6-GFP. TRPC5 coimmunoprecipitated more robustly with endogenous activated Rac1 compared to TRPC6 (upper panel). In contrast, TRPC6 coimmunoprecipitated more robustly with endogenous activated RhoA compared to TRPC5 (middle panel). TRPC5-GFP and TRPC6-GFP were detected in cell lysates (lower panel) (*P < 0.05; **P < 0.01; ***P < 0.001). WB, Western blot; IP, immunoprecipitation; OD, optical density.
Fig. 4
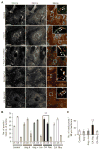
Membrane localization of TRPC5 and TRPC6 in podocytes. (A) TRPC6 and TRPC5 immunocytochemistry in AT1R podocytes reveals punctate structures on the cell membrane and a granular distribution in the cytoplasm. Merged images and high-power insets (×63) reveal that TRPC6-labeled puncta are distinct from TRPC5 puncta, with exceptions indicated in yellow. In untreated controls, TRPC6 puncta (green) represent >60% of total puncta on the cell membrane compared to >35% for TRPC5. This pattern persists after Ang II or losartan treatment. In the presence of CA RacV14, the pattern changes, with 60% of membrane puncta represented by TRPC5 (red). In the presence of CA RhoV12 the pattern returns to baseline, with TRPC6-labeled puncta predominance. Scale bar, 10 μm. (B) Quantification of puncta normalized to the total number of puncta visualized. m, merged. (C) Quantification of total puncta per standardized membrane length (50 μm) reveals significantly increased membrane insertion of puncta only in the presence of CA RacV14. Ang II did not result in a statistically significant increase in the number of puncta on the cell membrane (**P < 0.01).
Fig. 5
Functional coupling of TRPC5 to Rac1 and TRPC6 to RhoA. (A) DN RhoN19 abolished stress fibers. DN RacN17 and CA RhoV14 rescued stress fiber formation. In contrast, CA RacV12 abolished stress fibers and allowed the formation of prominent ruffles and filopodia. Scale bar, 20 μm. Ang II–treated AT1R podocytes expressing TRPC5 shRNA or dominant-negative TRPC5 (DNC5) displayed prominent stress fibers. DN RhoN19 or wild-type TRPC5 (WTC5) abrogated stress fibers in TRPC5-depleted cells. CA RacV12 reversed the DNC5 phenotype. Ang II–treated podocytes over-expressing TRPC6 shRNA or dominant-negative TRPC6 (DNC6) displayed loss of stress fibers. DN RacN17 promoted stress fiber and actin arc formation in C6 shRNA cells. Restoration of TRPC6 in the background of C6 shRNA [C6 shRNA + wild-type (WT) C6] also restored actin arc and stress fiber formation. CA RhoV14 rescued stress fibers in DNC6 cells. Scale bar, 20 μm. (B) Quantification of stress fibers in podocytes (see text for details) (###P < 0.001, statistically significant decrease in the number of stress fibers between no Ang II/scrambled shRNA controls and Losartan-treated/scrambled shRNA controls versus Ang II–treated/scrambled shRNA controls; ***P < 0.001).
Fig. 6
Synaptopodin degradation in TRPC6-depleted podocytes is rescued by CsA. (A) Serum-starved Scr shRNA control cells display prominent synaptopodin staining along the stress fibers. Treatment of serum-starved podocytes with Ang II results in actin arc formation and loss of stress fibers and synaptopodin staining. TRPC5-depleted cells display prominent stress fibers and synaptopodin staining. In contrast, stress fibers and synaptopodin staining are abrogated in TRPC6-depleted cells, where synaptopodin aggregates in clumps throughout the cytoplasm. Treatment of TRPC6-depleted cells with CsA (500 ng/ml) rescues stress fiber formation and restores synaptopodin staining along the stress fibers. (B) Quantification of stress fibers in CsA-treated TRPC6-depleted cells compared to the other conditions (see text for details) (###P < 0.001; ***P < 0.001).
Fig. 7
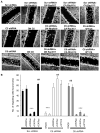
TRPC5 promotes and TRPC6 inhibits podocyte migration. (A) Wound assays at 36 hours. In control Scr shRNA AT1R podocytes, DN RhoN19 induced modest cell migration into the wound, whereas DN RacN17 abrogated migration. CA RhoV14 cells displayed minimal migration, whereas CA RacV12 cells displayed robust migration across the wound. TRPC5-depleted cells and dominant-negative TRPC5-expressing podocytes showed attenuated migration. DN RhoN19 or CA RacV12 promoted migration of TRPC5-depleted cells. Reconstitution of wild-type TRPC5 channels in a C5 shRNA background also induce robust migration into the wound. TRPC6-depleted cells and dominant-negative TRPC6-expressing cells showed increased migration into the wound. DN RacN17, CA RhoV14, or WT TRPC6 on a C6 shRNA background reduced migration. Scale bar, 1 mm. (B) Quantification of migrating podocytes (see text for details) (***P < 0.001; ##P < 0.01 compared to Scr shRNA podocytes).
Fig. 8
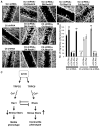
Antagonistic regulation of cell migration by TRPC5 and TRPC6. (A) TRPC5 promotes and TRPC6 inhibits fibroblast migration. Control Scr shRNA–expressing cells showed serum-induced migration within 24 hours. Similarly, DN RhoN19 induced fibroblast migration, whereas DN RacN17 and CA RhoV12 abrogated migration. Migration was enhanced by CA RacV12. DN RhoN19 or CA RacV12 restored migration in TRPC5-depleted fibroblasts. In contrast, TRPC6-depleted cells showed increased cell migration relative to controls, which was abrogated by DN RacN17 and CA RhoV14. Scale bar, 1 mm. (B) Quantification of migrating fibroblasts (see text for details) (***P < 0.001; ##P < 0.01). (C) A model for the conserved roles of TRPC5 and TRPC6 in the regulation of actin dynamics and cell motility. Under physiologic conditions, stimulation of AT1R activates both TRPC6 and TRPC5 channels, allowing the influx of Ca2+, thereby promoting activation of RhoA and Rac1, which are mutually inhibitory. Activation of the TRPC5-Rac1 complex inhibits RhoA and mediates stress fiber disassembly, thus promoting cell motility. In contrast, activation of the TRPC6-RhoA complex inhibits Rac1 activity and promotes stress fiber formation, thus mediating a contractile cell phenotype.
Similar articles
- Balancing calcium signals through TRPC5 and TRPC6 in podocytes.
Greka A, Mundel P. Greka A, et al. J Am Soc Nephrol. 2011 Nov;22(11):1969-80. doi: 10.1681/ASN.2011040370. Epub 2011 Oct 6. J Am Soc Nephrol. 2011. PMID: 21980113 Free PMC article. Review. - Regulation by afadin of cyclical activation and inactivation of Rap1, Rac1, and RhoA small G proteins at leading edges of moving NIH3T3 cells.
Miyata M, Rikitake Y, Takahashi M, Nagamatsu Y, Yamauchi Y, Ogita H, Hirata K, Takai Y. Miyata M, et al. J Biol Chem. 2009 Sep 4;284(36):24595-609. doi: 10.1074/jbc.M109.016436. Epub 2009 Jul 9. J Biol Chem. 2009. PMID: 19589776 Free PMC article. - Syndecan-4 ectodomain evokes mobilization of podocyte TRPC6 channels and their associated pathways: An essential role for integrin signaling.
Kim EY, Roshanravan H, Dryer SE. Kim EY, et al. Biochim Biophys Acta. 2015 Oct;1853(10 Pt A):2610-20. doi: 10.1016/j.bbamcr.2015.07.011. Epub 2015 Jul 17. Biochim Biophys Acta. 2015. PMID: 26193076 - The proteoglycan syndecan 4 regulates transient receptor potential canonical 6 channels via RhoA/Rho-associated protein kinase signaling.
Liu Y, Echtermeyer F, Thilo F, Theilmeier G, Schmidt A, Schülein R, Jensen BL, Loddenkemper C, Jankowski V, Marcussen N, Gollasch M, Arendshorst WJ, Tepel M. Liu Y, et al. Arterioscler Thromb Vasc Biol. 2012 Feb;32(2):378-85. doi: 10.1161/ATVBAHA.111.241018. Epub 2011 Dec 8. Arterioscler Thromb Vasc Biol. 2012. PMID: 22155451 Free PMC article. - FilGAP and its close relatives: a mediator of Rho-Rac antagonism that regulates cell morphology and migration.
Nakamura F. Nakamura F. Biochem J. 2013 Jul 1;453(1):17-25. doi: 10.1042/BJ20130290. Biochem J. 2013. PMID: 23763313 Review.
Cited by
- The Prediction of Key Cytoskeleton Components Involved in Glomerular Diseases Based on a Protein-Protein Interaction Network.
Ding F, Tan A, Ju W, Li X, Li S, Ding J. Ding F, et al. PLoS One. 2016 May 26;11(5):e0156024. doi: 10.1371/journal.pone.0156024. eCollection 2016. PLoS One. 2016. PMID: 27227331 Free PMC article. - Cytoskeleton Rearrangements Modulate TRPC6 Channel Activity in Podocytes.
Shalygin A, Shuyskiy LS, Bohovyk R, Palygin O, Staruschenko A, Kaznacheyeva E. Shalygin A, et al. Int J Mol Sci. 2021 Apr 22;22(9):4396. doi: 10.3390/ijms22094396. Int J Mol Sci. 2021. PMID: 33922367 Free PMC article. - Podocyte Sphingolipid Signaling in Nephrotic Syndrome.
Li G, Kidd J, Gehr TWB, Li PL. Li G, et al. Cell Physiol Biochem. 2021 Apr 17;55(S4):13-34. doi: 10.33594/000000356. Cell Physiol Biochem. 2021. PMID: 33861526 Free PMC article. Review. - Unveiling Angiotensin II and Losartan-Induced Gene Regulatory Networks Using Human Urine-Derived Podocytes.
Thimm C, Erichsen L, Wruck W, Adjaye J. Thimm C, et al. Int J Mol Sci. 2023 Jun 23;24(13):10551. doi: 10.3390/ijms241310551. Int J Mol Sci. 2023. PMID: 37445727 Free PMC article. - Transient receptor potential (TRP) channels: a clinical perspective.
Kaneko Y, Szallasi A. Kaneko Y, et al. Br J Pharmacol. 2014 May;171(10):2474-507. doi: 10.1111/bph.12414. Br J Pharmacol. 2014. PMID: 24102319 Free PMC article. Review.
References
- Clapham DE. Calcium signaling. Cell. 2007;131:1047–1058. - PubMed
- Etienne-Manneville S, Hall A. Rho GTPases in cell biology. Nature. 2002;420:629–635. - PubMed
- Pertz O, Hodgson L, Klemke RL, Hahn KM. Spatiotemporal dynamics of RhoA activity in migrating cells. Nature. 2006;440:1069–1072. - PubMed
Publication types
MeSH terms
Substances
LinkOut - more resources
Full Text Sources
Other Literature Sources
Molecular Biology Databases
Research Materials
Miscellaneous
