Second-generation environmental sequencing unmasks marine metazoan biodiversity - PubMed (original) (raw)
Second-generation environmental sequencing unmasks marine metazoan biodiversity
Vera G Fonseca et al. Nat Commun. 2010.
Free PMC article
Abstract
Biodiversity is of crucial importance for ecosystem functioning, sustainability and resilience, but the magnitude and organization of marine diversity at a range of spatial and taxonomic scales are undefined. In this paper, we use second-generation sequencing to unmask putatively diverse marine metazoan biodiversity in a Scottish temperate benthic ecosystem. We show that remarkable differences in diversity occurred at microgeographical scales and refute currently accepted ecological and taxonomic paradigms of meiofaunal identity, rank abundance and concomitant understanding of trophic dynamics. Richness estimates from the current benchmarked Operational Clustering of Taxonomic Units from Parallel UltraSequencing analyses are broadly aligned with those derived from morphological assessments. However, the slope of taxon rarefaction curves for many phyla remains incomplete, suggesting that the true alpha diversity is likely to exceed current perceptions. The approaches provide a rapid, objective and cost-effective taxonomic framework for exploring links between ecosystem structure and function of all hitherto intractable, but ecologically important, communities.
Figures
Figure 1. Lineage-through-time plots for OCTUPUS and ESPRIT.
Mean number of OTUs plotted against each percentage identity cut-off (90–99% similarity) generated using 5,000 subsampled sequences (>199 bases in length) from three independent sample sites (Prestwick 2, 7 and Littlehampton 1) using OCTUPUS (blue squares) and ESPRIT's HCluster (red circles) OTU clustering. Values are given as average+s.d. (_n_=9).
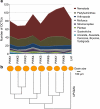
Figure 2. Taxon richness and community similarity in relation to ecology and space.
(a) Number of different OCTUs per sample for each phylum after data standardization derived from the Prestwick (eight sampling sites) and Littlehampton (one sampling site) marine littoral benthos; (b) grain size represents the relative 50% cumulative median grain size (μm) per site, and cluster analyses (UPGMA) using Sorensen's Coefficient represent the number of shared OCTUs between the nine independent samples. The positive relationship between grain size and sample richness is highly significant (Spearman's correlation coefficient, _n_=9, _ρ_=−0.83, _P_=0.0108).
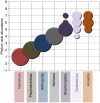
Figure 3. Phylum rank abundance plot.
Community assemblage OCTU richness rank order for the main phyla recovered from the Prestwick and Littlehampton samples (after data standardization). The frequency of ranking (out of the nine samples) is represented by the diameter of the symbol at each rank. Single symbols per phylum represent a constant ranking, whereas multiple symbols highlight variance in phylum rank order throughout the samples.
Figure 4. Percentage identity to known sequences and number of OCTUs found for the main phyla.
(a) Number of different OCTUs for the main phyla recovered from the Prestwick and Littlehampton meiofaunal samples and their different levels of identity to nSSU in the GenBank/EMBL/DDBJ nucleotide database. (b) Putative taxonomic classification of 39 OCTUs that had less than 90% sequence identity to nSSU in GenBank/EMBL/DDBJ. We acknowledge and thank Richard Ling (Platyhelminthes), Frederico Batista (Mollusca), David Mann (Stramenopile), Greg Rouse (Annelida), Charisa Wernick/MicroscopeWorld (Alveolata), Tim Ferrero (Nematoda), Kim Taylor/Warren Photographic (Arthropoda), Graham Matthews (Gastrotricha) and David Bass (Cercozoa), who gave permission to use the images in Figure 4a.
Figure 5. Rarefaction curves of the abundance-based coverage estimation (ACE) diversity estimator.
Plots are shown for (a) Nematoda, (b) Platyhelminthes, (c) Arthropoda (blue) and Mollusca (red dashed), (d) Stramenopiles (blue) and Annelida (dashed red) at 96% identity OCTU cut-off for the Prestwick meiobenthic samples 1–8. Curves were estimated from 100 randomizations, without replacement, using EstimateS, version 8.2.0.
References
- Blaxter M. Molecular systematics—counting angels with DNA. Nature 421, 122–124 (2003). - PubMed
- May R. M. How many species are there on earth. Science 241, 1441–1449 (1988). - PubMed
- Huber J. A. et al.. Microbial population structures in the deep marine biosphere. Science 318, 97–100 (2007). - PubMed
Publication types
MeSH terms
LinkOut - more resources
Full Text Sources


