Atherogenic lipids and lipoproteins trigger CD36-TLR2-dependent apoptosis in macrophages undergoing endoplasmic reticulum stress - PubMed (original) (raw)
. 2010 Nov 3;12(5):467-82.
doi: 10.1016/j.cmet.2010.09.010.
Marissa J Nadolski, Xianghai Liao, Jorge Magallon, Matthew Nguyen, Nicole T Feric, Marlys L Koschinsky, Richard Harkewicz, Joseph L Witztum, Sotirios Tsimikas, Douglas Golenbock, Kathryn J Moore, Ira Tabas
Affiliations
- PMID: 21035758
- PMCID: PMC2991104
- DOI: 10.1016/j.cmet.2010.09.010
Atherogenic lipids and lipoproteins trigger CD36-TLR2-dependent apoptosis in macrophages undergoing endoplasmic reticulum stress
Tracie A Seimon et al. Cell Metab. 2010.
Abstract
Macrophage apoptosis in advanced atheromata, a key process in plaque necrosis, involves the combination of ER stress with other proapoptotic stimuli. We show here that oxidized phospholipids, oxidized LDL, saturated fatty acids (SFAs), and lipoprotein(a) trigger apoptosis in ER-stressed macrophages through a mechanism requiring both CD36 and Toll-like receptor 2 (TLR2). In vivo, macrophage apoptosis was induced in SFA-fed, ER-stressed wild-type but not Cd36⁻(/)⁻ or Tlr2⁻(/)⁻ mice. For atherosclerosis, we combined TLR2 deficiency with that of TLR4, which can also promote apoptosis in ER-stressed macrophages. Advanced lesions of fat-fed Ldlr⁻(/)⁻ mice transplanted with Tlr4⁻(/)⁻Tlr2⁻(/)⁻ bone marrow were markedly protected from macrophage apoptosis and plaque necrosis compared with WT →Ldlr⁻(/)⁻ lesions. These findings provide insight into how atherogenic lipoproteins trigger macrophage apoptosis in the setting of ER stress and how TLR activation might promote macrophage apoptosis and plaque necrosis in advanced atherosclerosis.
Copyright © 2010 Elsevier Inc. All rights reserved.
Figures
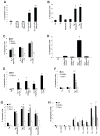
Figure 1. OxPLs, oxLDL, and Lp(a) Induce CD36- and TLR2/6-Dependent Apoptosis in ER-Stressed Macrophages
For all the experiments described below, the experimental endpoint was macrophage apoptosis; the data are expressed as the percent of total cells that stained with annexin V and propidium iodide (mean ± SEM; n=4). Differences between values with symbols and no symbols, or between values with different symbols, are statistically significant (p values ranged from < 0.05 to < 0.001). (A) Macrophages were incubated for 28 h with 0.25 μM thapsigargin (Tg) alone or thapsigargin in combination with the indicated concentrations of ox-LDL. (B) Macrophages were left untreated (Un) or incubated for 30 h with 0.25 μM thapsigargin alone or thapsigargin in combination with 10 μg/ml of KDdia-PC or POV-PC, or the phospholipids alone. (C) Macrophages from WT, Sra−/−, or Cd36−/− mice were incubated for 18 h with thapsigargin alone or thapsigargin in combination with 10 μg/ml POV-PC or KDdia-PC or with 50 μg/ml of ox-LDL. (D) Macrophages were left untreated or incubated for 23 h with 50 μg/ml KOdia-PC without (mock) or with (PLA2) pretreatment with phospholipase A2, alone or in combination with 0.5 μM thapsigargin (Tg). (E) Macrophages from WT or Tlr2−/− mice were incubated for 30 h with 0.25 μM thapsigargin alone or thapsigargin combined with KDdia-PC, POV-PC, ox-LDL, or LTA. (F) Macrophages from WT, Cd36−/−, or Tlr2−/− mice were incubated for 24 h with thapsigargin alone or thapsigargin combined with 10 μg/ml LTA. (G) Macrophages from WT, _Tlr1_−/−, or _Tlr6_−/− mice were incubated for 24 h with thapsigargin with or without KOdia-PC, LTA, or 10ug/ml Pam3CSK4 or Pam2CSK4. (H) Macrophages from WT, _Cd36_−/−, or _Tlr2_−/− mice were incubated for 18 h with 0.25 μM thapsigargin (Tg) alone; 0.25 mM of the indicated fatty acids in complex with BSA; or thapsigargin plus either the fatty acids or BSA control. The unsaturated fatty acids were linoleic acid (18:2) and oleic acid (18:1), and the saturated fatty acids were stearic acid (18:0) and palmitic acid (16:0).
Figure 2. CD36 Ligand-Induced Apoptosis in ER-stressed Macrophages is Dependent on Reactive Oxygen Species (ROS)
(A–B) Macrophages were pre-incubated for 60 min in the absence or presence of 100 μM N-acetylcysteine (NAC) and then incubated for 24 h in medium alone (Un) or containing 0.25 μM thapsigargin (Tg), 20 μg/ml KDdia-PC or Tg and KDdia-PC, as indicated. The cells were then assayed for ROS, using the DCF fluorescence assay, and apoptosis. (C–D) As above, but here the ER stressor was 5 μg/ml 7-ketocholesterol or 2 mM SIN-1 instead of thapsigargin. Differences between values with symbols and no symbols, or between values with different symbols, are statistically significant (p values ranged from < 0.05 to < 0.01).
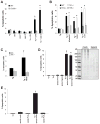
Figure 3. Lp(a) Triggers Apoptosis in ER-Stressed Macrophages in a CD36-TLR2-Oxidative Stress-Dependent Manner
(A–B) Macrophages from WT, Cd36−/−, Tlr2−/−, _Tlr1_−/−, or _Tlr6_−/− mice were incubated for 24 h with 0.5 μM thapsigargin alone or in combination with 25 μg/ml LDL or Lp(a), 50 μg/ml KOdia-PC, or 10 μg/ml LTA. (C) Apoptosis data for macrophages that were pre-incubated with or without 500 μM N-acetylcysteine (NAC) and then incubated for 24 h with thapsigargin alone or with 50 μg/ml of Lp(a). (D) Macrophages were incubated for 22 h with thapsigargin alone or in combination with 25 μg/ml apo(a) that was pre-treated in the absence (mock) or presence of trypsin and then assayed for apoptosis. The image shows a Coomassie-stained SDS-polyacrylamide electrophoresis gel of mock and trypsin-treated apo(a); for each condition, three different amounts of proteins were loaded per lane, increasing from left to right. (E) As in D, but here the apo(a) was treated with ± PLA2 prior to trypsinization. *, p < 0.01 compared to other groups without the asterisk.
Figure 4. Sustained Activation of NADPH Oxidase by CD36 Ligands in ER-Stressed Macrophages
(A) Macrophages from WT, _Cd36_−/−, _Nox2_−/−, or _Tlr2_−/− mice were incubated for the indicated times with 0.25 μM thapsigargin (Tg) alone or in combination with 20 μg/ml POV-PC and then assayed for the percent of DCF-positive cells (ROS). (B) Macrophages from WT or _Nox2_−/− mice were incubated for 24 h with thapsigargin alone or in combination with KOdia-PC, 10 μg/ml LTA, or 0.25 mM palmitic acid (PA). The cells were then assayed for apoptosis. (C) Macrophages were incubated for 4 h in medium alone or medium containing KOdia-PC, thapsigargin or the two reagents combined and then subjected to immunofluorescence for p47phox (red) and labeling with LysoTracker® Green and the nuclear stain DAPI (blue). Treatment with LPS for 30 min was used as a positive control. Bar, 5 μm. (D) Quantification of the data at two timepoints for the experiment in C, expressed as the percent of total cells that exhibited p47 clustering (mean ± SEM, n=4). Differences between values with symbols and no symbols, or between values with different symbols, are statistically significant (p < 0.05).
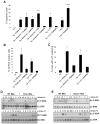
Figure 5. TLR2-Dependent ERK Activation Promotes Apoptosis, ROS Generation, and p47phox Clustering
(A–C) Macrophages were left untreated (Un) or incubated for 24 h with the ER stressors thapsigargin or 7-ketocholesterol alone or in combination with KOdia-PC or LTA. Some of the samples were pre-treated for 1 h with 250 nM of the conventional or pan PKC inhibitors Go6976 and Go6983, respectively; 10 μM of the Src-like kinase inhibitor PP2; or 10 μM of the MEK1 inhibitor PD98059. The cells were then analyzed for apoptosis (A), DCF positivity (B), or p47phox clustering (C). (D–E) Macrophages from WT, Nox2−/−, or Tlr2−/− mice were incubated with KDdia-PC alone for the indicated times. Cell lysates were then immunoblotted for Thr202/Tyr204-phospho-ERK1/2 and total ERK. Differences between values with symbols and no symbols, or between values with different symbols, are statistically significant (p < 0.05).
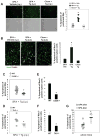
Figure 6. SFAs Trigger CD36- and TLR2-Dependent Macrophage Apoptosis In Vivo
(A–B) Mice were fed a regular chow diet or a diet containing saturated fatty acids (SFAs) for two weeks. Concanavalin A was administered i.p., and two days later the mice were given an i.p. injection of 150 mM dextrose (vehicle) or 0.4 mg/kg of thapsigargin (Tg) in dextrose. (A) Macrophages were harvested from the peritoneum 24 h later and stained immediately with alexa-488 annexin-V and propidium iodide. Representative fluorescent and bright-field images are shown. Bar, 20 μm. The dot plot shows the quantified data for each individual mouse, which was obtained from 5 individual fields/mouse. The horizontal line represents the mean in each group (*p < 0.05). (B) Spleens harvested from these mice were sectioned and stained for the macrophage marker Mac3 (green) and for apoptosis by TUNEL (red) (Bar, 10 μm; *p < 0.05). (C–F) WT, _Cd36_−/−, and _Tlr2_−/− mice were fed a SFA-rich diet for 2 wks and then treated with thapsigargin as described above. Peritoneal macrophages (C–D) and splenic macrophages (E–F) were then assayed for apoptosis. (G) ob/ob mice were fed a diet rich in SFAs or unsaturated fatty acids (UFA) for 2 wks, and then freshly isolated peritoneal macrophages were assayed for apoptosis. The horizontal lines in C, E, and G represent the mean value in each group (*p < 0.05).
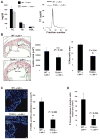
Figure 7. TLR2/4 Deficiency in Bone Marrow-Derived Cells Suppress Apoptosis and Plaque Necrosis in Advanced Aortic Root Lesions of Fat-Fed _Ldlr_−/− Mice
_Ldlr_−/− mice were transplanted with Tlr2+/+Tlr4+/+ (wild-type, WT) or _Tlr2_−/−_Tlr4_−/− bone marrow and then fed a Western-type diet for 10 wks starting 4 wks after transplantation. (A) Plasma cholesterol, triacylglycerol, HDL, and FPLC lipoprotein profile of the 2 groups of mice. There were no statistical differences between the 2 groups in any of the values. (B–D) Images and quantification of lesion area and percent necrotic area (n=10 and n=9), percent of TUNEL-positive cells (n=10 and n=7), percent activated caspase-3 positive cells (n=8 and n=9) in the lesions of WT → _Ldlr_−/− and _Tlr2_−/−_Tlr4_−/− → _Ldlr_−/− mice respectively. Panel B shows hematoxylin and eosin staining of the sections with the necrotic area outlined (dotted black lines), and panel C shows TUNEL (red) and DAPI (blue) staining. The P values shown in panels B–D were derived from the Mann-Whitney test. Bars in B and C, 20 and 15 μm, respectively.
Comment in
- Lipids and stress — a deadly duo.
Bird L. Bird L. Nat Rev Immunol. 2010 Dec;10(12):809. doi: 10.1038/nri2899. Nat Rev Immunol. 2010. PMID: 21155171 No abstract available.
Similar articles
- Differential Expression of Inflammarafts in Macrophage Foam Cells and in Nonfoamy Macrophages in Atherosclerotic Lesions-Brief Report.
Navia-Pelaez JM, Agatisa-Boyle C, Choi SH, Sak Kim Y, Li S, Alekseeva E, Weldy K, Miller YI. Navia-Pelaez JM, et al. Arterioscler Thromb Vasc Biol. 2023 Feb;43(2):323-329. doi: 10.1161/ATVBAHA.122.318006. Epub 2022 Dec 1. Arterioscler Thromb Vasc Biol. 2023. PMID: 36453276 Free PMC article. - Signal transducer and activator of transcription-1 is critical for apoptosis in macrophages subjected to endoplasmic reticulum stress in vitro and in advanced atherosclerotic lesions in vivo.
Lim WS, Timmins JM, Seimon TA, Sadler A, Kolodgie FD, Virmani R, Tabas I. Lim WS, et al. Circulation. 2008 Feb 19;117(7):940-51. doi: 10.1161/CIRCULATIONAHA.107.711275. Epub 2008 Jan 28. Circulation. 2008. PMID: 18227389 Free PMC article. - CD36/SR-B2-TLR2 Dependent Pathways Enhance Porphyromonas gingivalis Mediated Atherosclerosis in the Ldlr KO Mouse Model.
Brown PM, Kennedy DJ, Morton RE, Febbraio M. Brown PM, et al. PLoS One. 2015 May 4;10(5):e0125126. doi: 10.1371/journal.pone.0125126. eCollection 2015. PLoS One. 2015. PMID: 25938460 Free PMC article. - Dual signaling evoked by oxidized LDLs in vascular cells.
Nègre-Salvayre A, Augé N, Camaré C, Bacchetti T, Ferretti G, Salvayre R. Nègre-Salvayre A, et al. Free Radic Biol Med. 2017 May;106:118-133. doi: 10.1016/j.freeradbiomed.2017.02.006. Epub 2017 Feb 9. Free Radic Biol Med. 2017. PMID: 28189852 Review. - Oxidized phospholipids as endogenous pattern recognition ligands in innate immunity.
Hazen SL. Hazen SL. J Biol Chem. 2008 Jun 6;283(23):15527-31. doi: 10.1074/jbc.R700054200. Epub 2008 Feb 19. J Biol Chem. 2008. PMID: 18285328 Free PMC article. Review. No abstract available.
Cited by
- Multimolecular signaling complexes enable Syk-mediated signaling of CD36 internalization.
Heit B, Kim H, Cosío G, Castaño D, Collins R, Lowell CA, Kain KC, Trimble WS, Grinstein S. Heit B, et al. Dev Cell. 2013 Feb 25;24(4):372-83. doi: 10.1016/j.devcel.2013.01.007. Epub 2013 Feb 7. Dev Cell. 2013. PMID: 23395392 Free PMC article. - Aberrant endoplasmic reticulum stress in vascular smooth muscle increases vascular contractility and blood pressure in mice deficient of AMP-activated protein kinase-α2 in vivo.
Liang B, Wang S, Wang Q, Zhang W, Viollet B, Zhu Y, Zou MH. Liang B, et al. Arterioscler Thromb Vasc Biol. 2013 Mar;33(3):595-604. doi: 10.1161/ATVBAHA.112.300606. Epub 2013 Jan 3. Arterioscler Thromb Vasc Biol. 2013. PMID: 23288166 Free PMC article. - Type 2 diabetes mellitus: From a metabolic disorder to an inflammatory condition.
Hameed I, Masoodi SR, Mir SA, Nabi M, Ghazanfar K, Ganai BA. Hameed I, et al. World J Diabetes. 2015 May 15;6(4):598-612. doi: 10.4239/wjd.v6.i4.598. World J Diabetes. 2015. PMID: 25987957 Free PMC article. Review. - Cholesterol-Induced Phenotypic Modulation of Smooth Muscle Cells to Macrophage/Fibroblast-like Cells Is Driven by an Unfolded Protein Response.
Chattopadhyay A, Kwartler CS, Kaw K, Li Y, Kaw A, Chen J, LeMaire SA, Shen YH, Milewicz DM. Chattopadhyay A, et al. Arterioscler Thromb Vasc Biol. 2021 Jan;41(1):302-316. doi: 10.1161/ATVBAHA.120.315164. Epub 2020 Oct 8. Arterioscler Thromb Vasc Biol. 2021. PMID: 33028096 Free PMC article. - Role of phospholipid oxidation products in atherosclerosis.
Lee S, Birukov KG, Romanoski CE, Springstead JR, Lusis AJ, Berliner JA. Lee S, et al. Circ Res. 2012 Aug 31;111(6):778-99. doi: 10.1161/CIRCRESAHA.111.256859. Circ Res. 2012. PMID: 22935534 Free PMC article. Review.
References
- NHLBI Morbidity and Mortality Chart Book. Bethesda, MD: National Heart, Lung, and Blood Institute; 2007.
- Adachi O, Kawai T, Takeda K, Matsumoto M, Tsutsui H, Sakagami M, Nakanishi K, Akira S. Targeted disruption of the MyD88 gene results in loss of IL-1- and IL-18-mediated function. Immunity. 1998;9:143–150. - PubMed
- Bergmark C, Dewan A, Orsoni A, Merki E, Miller ER, Shin MJ, Binder CJ, Horkko S, Krauss RM, Chapman MJ, Witztum JL, Tsimikas S. A novel function of lipoprotein [a] as a preferential carrier of oxidized phospholipids in human plasma. J Lipid Res. 2008;49:2230–2239. - PubMed
- Bey EA, Xu B, Bhattacharjee A, Oldfield CM, Zhao X, Li Q, Subbulakshmi V, Feldman GM, Wientjes FB, Cathcart MK. Protein kinase C delta is required for p47phox phosphorylation and translocation in activated human monocytes. J Immunol. 2004;173:5730–5738. - PubMed
- Borradaile NM, Han X, Harp JD, Gale SE, Ory DS, Schaffer JE. Disruption of endoplasmic reticulum structure and integrity in lipotoxic cell death. J Lipid Res. 2006;47:2726–2737. - PubMed
Publication types
MeSH terms
Substances
Grants and funding
- GM069338/GM/NIGMS NIH HHS/United States
- GM54060/GM/NIGMS NIH HHS/United States
- AG020255/AG/NIA NIH HHS/United States
- R37 GM054060/GM/NIGMS NIH HHS/United States
- T35 HL007616/HL/NHLBI NIH HHS/United States
- AG032349/AG/NIA NIH HHS/United States
- R01 HL075662/HL/NHLBI NIH HHS/United States
- R01 AG032349/AG/NIA NIH HHS/United States
- T32 HL007343/HL/NHLBI NIH HHS/United States
- HL075662/HL/NHLBI NIH HHS/United States
- U54 GM069338/GM/NIGMS NIH HHS/United States
- R01 GM054060/GM/NIGMS NIH HHS/United States
- R01 AI052455/AI/NIAID NIH HHS/United States
- HL087123/HL/NHLBI NIH HHS/United States
- P01 HL087123/HL/NHLBI NIH HHS/United States
- R01 AG020255/AG/NIA NIH HHS/United States
LinkOut - more resources
Full Text Sources
Other Literature Sources
Molecular Biology Databases
