Storage vesicles in neurons are related to Golgi complex alterations in mucopolysaccharidosis IIIB - PubMed (original) (raw)
Storage vesicles in neurons are related to Golgi complex alterations in mucopolysaccharidosis IIIB
Sandrine Vitry et al. Am J Pathol. 2010 Dec.
Abstract
The accumulation of intracellular storage vesicles is a hallmark of lysosomal storage diseases. Neither the identity nor origin of these implicated storage vesicles have yet been established. The vesicles are often considered as lysosomes, endosomes, and/or autophagosomes that are engorged with undigested materials. Our studies in the mouse model of mucopolysaccharidosis type IIIB, a lysosomal storage disease that induces neurodegeneration, showed that large storage vesicles in cortical neurons did not receive material from either the endocytic or autophagy pathway, which functioned normally. Storage vesicles expressed GM130, a Golgi matrix protein, which mediates vesicle tethering in both pre- and cis-Golgi compartments. However, other components of the tethering/fusion complex were not associated with GM130 on storage vesicles, likely accounting for both the resistance of the vesicles to brefeldin A and the alteration of Golgi ribbon architecture, which comprised distended cisterna connected to LAMP1-positive storage vesicles. We propose that alteration in the GM130-mediated control of vesicle trafficking in pre-Golgi and Golgi compartments affects Golgi biogenesis and gives rise to a dead-end storage compartment. Vesicle accumulation, Golgi disorganization, and alterations of other GM130 functions may account for neuron dysfunction and death.
Figures
Figure 1
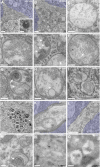
Vesicles accumulating in the MPSIIIB mouse rostral cortex are distinct from lysosomes. A–M: Rostral cortex fragments of 8-month-old wild-type (A) or MPSIIIB mice (B–M) were processed for electron microscopy on ultrathin sections. Low magnification images of wild-type (A) and MPSIIIB neurons (B) show polymorphic distended vesicles in the affected cell. A normal lysosome is shown in A (inset). High magnifications of vesicles present in MPSIIIB neuron soma (C–I) show intraluminal electro-dense fibrillar (C), granular (D), globular (arrowheads in E), or multilamellar (arrows in E–G) materials. A sequestered vesicle is visible in H (double arrowhead). Images consistent with vesicle fusion or scission were observed (I). Vesicles with zebra bodies are shown in I. Enlargement of a process filled with dense vesicular bodies is visible in J. Vesicles also accumulate in myelinated axons (K) and in dendrites (L–M). A dendritic multivesicular body with normal aspect juxtaposed to a vesicle loaded with multilamellar material (arrow) is shown (M). Azure stains tissue beyond cell limits. Ly, lysosome; mye, myelin; MVB, multivesicular body; n, nucleus. Scale bars, 1 μm (A, B, J, and L); 0.2 μm (C–H, K, and M); 0.4 μm (I). N and O: Ultrathin cryosections from wild-type (N) or MPSIIIB (O) rostral cortex were immunostained for LAMP1 using 15 nm gold particles, revealing LAMP1 in small vesicles (N) or in limiting membranes of most distended vesicles (O). Scale bars, 0.2 μm.
Figure 2
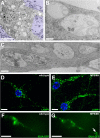
Storage vesicles accumulate in MPSIIIB mouse cortical neuron cultures. A–C: MPSIIIB embryonic cortical neuron cultures were fixed at day 7 to 16 and processed for electron microscopy. Many polymorphic vesicles are visible in the cell soma (A and B) and prolongations (C). Scale bars, 5 μm (A); 0.3 μm (B and C). D and E: Cultures of wild-type or MPSIIIB embryonic cortical neurons were fixed at day 12 and immunolabeled with anti-LAMP1 antibodies (green). Nuclei were counterstained in blue. Abundant and often distended LAMP1-positive vesicles are visible in MPSIIIB neuronal processes. Scale bars, 10 μm. F and G: Cultures of wild-type or MPSIIIB embryonic cortical neurons were exposed to a lentivirus vector coding for the fluorescent lysosomal hydrolase IDUA-GFP at day 7 and examined at day 12 by fluorescent time-lapse microscopy (see Supplemental Videos 1, 2, and 3 at http://ajp.amjpathol.org). A cluster of IDUA-GFP–positive vesicles is visible in a MPSIIIB neuronal process (arrow). Scale bars, 10 μm.
Figure 3
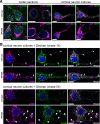
LAMP1-positive storage vesicles are not related to the endocytic pathway. A: Parasagittal rostral cortex sections of 8-month-old wild-type or MPSIIIB mice (cortex sections) and cultures of wild-type or MPSIIIB cortical neurons (cortical neuron cultures) were stained with anti-LAMP1 antibodies (in purple) in combination with anti-EEA1 (in green) or anti-M6PR (in green). Nuclei were counterstained in blue. Merged confocal images of cortical sections, or apotome images of cultured neurons, show that LAMP1 signals do not colocalize with endosomal vesicle markers. For single labeling, see Supplemental Figure 2 at http://ajp.amjpathol.org. Scale bars, 10 μm. B: Ten-day-old cortical neuron cultures established from wild-type or MPSIIIB mouse embryos were pulsed with biotinylated dextran for 5 minutes then fixed after 1 hour or 5 hours of chase. Biotinylated dextran was revealed with fluorescent streptavidin (in green) and cells were simultaneously immunolabeled with anti-LAMP1 antibodies (in purple). Nuclei were counterstained in blue. Apotome views show small doubly positive signals in soma and neurites (chase 1 hour, arrows). Note the absence of dextran signal in distended LAMP1-positive vesicles that are well visible in MPSIIIB neurites (chase 5 hours, arrowheads). Scale bars, 10 μm.
Figure 4
Macroautophagy is not altered in MPSIIIB mouse cortical neurons. A: Parasagittal sections of the rostral cortex of 8-month-old wild-type or MPSIIIB mice were immunolabeled for LAMP1 (in purple) and LC3 (in green). Nuclei were counterstained in blue. Confocal views show intense LAMP1 staining of MPSIIIB sections and similar diffuse LC3 staining pattern in wild-type and MPSIIIB. Scale bars, 10 μm. B: LC3-I to LC3-II conversion was analyzed by Western blots. Proteins were extracted from the rostral cortex of 8-month-old wild-type mice, untreated MPSIIIB mice, or MPSIIIB mice treated by intracerebral injection of AAV-NaGlu vector (MPSIIIB+AAV-NaGlu). The diagram on the right shows equivalent LC3-I signal intensities with respect to actin signals (means ± SEM from three mice). LC3-II was not detected in cortical tissue extracts in contrast to a positive control (Asterisk) provided by wild-type mouse cortical neuron cultures treated with rapamycin (250 nmol/L) and leupeptin (50 μmol/L) for 48 hours. C: Cultures of wild-type or MPSIIIB cortical neurons were treated at day 6 with vehicle (DMSO: D), or rapamycin (250 nmol/L, R), or rapamycin (250 nmol/L) and leupeptin (50 μmol/L, R + L). Neurons were fixed at day 8 and immunolabeled for LAMP1 (in purple) and LC3 (in green). Apotome views of neurons treated with rapamycin and leupeptin show LC3-positive vesicles in wild-type and MPSIIIB neurites (middle row). Scoring of LC3-positive vesicles along neurites in basal conditions and after drug treatment did not show significant difference between wild-type and MPSIIIB neurons (left diagram, means ± SEM from three independent cultures; P > 0.1, _t_-test). LC3 and LAMP1 signals did not colocalize more frequently in MPSIIIB than in wild-type cultures whatever the treatment (right diagram, means ± SEM from three independent cultures; P > 0.1, _t_-test). Scale bars, 10 μm. D: Proteins extracted at day 8 from neuron cultures maintained in basal conditions (DMSO: D), or incubated with rapamycin (R), or with rapamycin and leupeptin (R + L) for days 6 to 8 were analyzed by Western blots to examine LC3-I to LC3-II conversion. Signal quantification shows equivalent LC3-II/LC3-I ratios for each condition in wild-type and MPSIIIB neurons (means ± SEM from three independent cultures). E: The degradation of long-lived proteins was examined by metabolic labeling of cultured neurons with 3H-leucine. Ratios of 3H counts in culture supernatant (corresponding to the amount of degraded proteins) to cell pellet (corresponding to the number of labeled cells) were determined at day 8 in wild-type (gray lines) or MPSIIIB (black lines) neurons cultures, either in basal conditions (DMSO) or after treatment with rapamycin (250 nmol/L) for 48 hours (means ± SEM from three independent cultures, P > 0.1 for all time-points, Mann–Whitney test).
Figure 5
LAMP1-positive storage vesicles express GM130 in the MPSIIIB mouse brain. A: Parasagittal rostral cortex sections of 8-month-old wild-type or MPSIIIB mice were immunolabeled for LAMP1 and GM130. Confocal immunofluorescence (LAMP1 in purple, GM130 in green, nuclei counterstained in blue) shows frequent colocalization of LAMP1 and GM130 signals (in white) in MPSIIIB cortical sections. Scale bars, 10 μm. B–H: Immunogold electron microscopy was performed on ultra-thin cryosections of the rostral cortex of 8-month-old wild-type (B) or MPSIIIB (C–H) mice. Sections were labeled with anti-GM130 antibodies revealed with 10-nm gold particles alone or in combination with anti-LAMP1 antibodies revealed with 15-nm gold particles. Golgi structures decorated with GM13010 nm particles are shown (B and C). Distended vesicles in which the limiting membrane is doubly labeled with LAMP115 nm and GM13010 nm were frequently observed in MPSIIIB neurons (D–H). GC, Golgi complex. Scale bars, 0.2 μm.
Figure 6
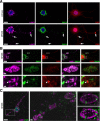
LAMP1-positive storage vesicles express GM130 and sec23COPII in MPSIIIB mouse neuron cultures. Wild-type or MPSIIIB cortical neurons cultures were fixed at day 11 and immunolabeled for LAMP1 (in purple), GM130 (in green), and sec23-COPII (in red in A and B, in green in C). Nuclei were counterstained in blue. A: Low-magnification confocal immunofluorescence views show vesicles triply positive for LAMP1, GM130, and COPII (arrows) in MPSIIIB neurites. Scale bars, 10 μm. B: Areas boxed in the low magnification view of a MPSIIIB neuron (upper row) were examined at high magnification. Middle row shows a cluster of distended vesicles costained with the three antibodies. Bottom row shows images consistent with the incorporation of a GM130-positive vesicle in a LAMP1-COPII-positive vesicular complex (arrowhead). Scale bars, 10 μm in upper row; 1 μm in middle and bottom rows. C: A low magnification confocal image of a MPSIIIB neuron costained with LAMP1 and COPII antibodies is shown on the left. A high-magnification deconvoluted image of the boxed area is shown in the middle. Contiguous staining for LAMP1 and COPII is visible in vesicle limiting membranes. Three-dimensional views of the vesicle in the upper right corner are shown in the right panels, without (top) or with (bottom) isosurface treatment. Scale bars, 10 μm in left image; 1 μm in middle image.
Figure 7
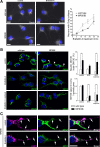
MPSIIIB neurons are partially resistant to brefeldin A. Wild-type or MPSIIIB cortical neuron cultures were treated with brefeldin A (BFA, 1.25 μg/ml) at day 7, fixed, and immunolabeled for giantin (white in A), GM130 (green in B and C), or LAMP1 (purple in C). A: Dense perinuclear giantin staining of Golgi complex (left column) gives rise to diffuse signal spread over neuronal bodies and processes after 25 minutes of BFA treatment (middle column). Slower kinetics of disappearance of perinuclear giantin staining in MPSIIIB neurons, when compared with wild type, is shown in the right diagram (means ± SEM from signals quantified in at least 300 neurons per condition in three independent cultures, P > 0.1, _t_-test). Scale bars, 10 μm. B: In control conditions, MPSIIIB neurons show increased GM130 signal in proximal neurites (upper row, arrowheads, upper diagram on the right). After 25 minutes in the presence of BFA, GM130 staining was dispersed over the cell, but still more intense in MPSIIIB soma than in wild type (middle row, diagrams on the right). Reconstitution of Golgi structures was visible 4 hours after washout (lower row). GM130 signal in neurites was 5.2-fold more intense in MPSIIIB than in wild type (upper diagram on the right). Values are means ± SEM from signals quantified in at least 90 neurons per condition in two independent cultures. *P < 0.0001 (_t_-test). Scale bars, 10 μm. C: BFA did not affect LAMP1 staining pattern (left column), whereas perinuclear GM130 staining became dispersed (middle column). Vesicles doubly positive for LAMP1 and GM130 (right column), which are well visible in neurites, were not affected by BFA treatment (arrows). Scale bars, 10 μm.
Figure 8
Disorganisation of Golgi architecture in MPSIIIB neurons. Rostral cortex sections (A–D and H), or day 7 cortical neuron cultures (E–G) were processed for ultrastructural morphology (A–G), or immunogold labeling for LAMP1 on cryosections (H). Pictures show typical Golgi complex in wild-type (A and E) and MPSIIIB neuronal soma (B, C, D, F, and G). Cisterna distensions adjacent to storage vesicles are well visible in MPSIIIB neurons. A distended Cisterna decorated with LAMP1 antibodies emerging from a Golgi tubular structure, which is also decorated with anti-LAMP1 antibodies, is shown in H. ER, endoplasmic reticulum; GC, Golgi complex; Ly, lysosome; m, mitochondria; n, nucleus; StV, storage vesicle. Scale bars, 0.5 μm.
Similar articles
- GM130 gain-of-function induces cell pathology in a model of lysosomal storage disease.
Roy E, Bruyère J, Flamant P, Bigou S, Ausseil J, Vitry S, Heard JM. Roy E, et al. Hum Mol Genet. 2012 Apr 1;21(7):1481-95. doi: 10.1093/hmg/ddr584. Epub 2011 Dec 12. Hum Mol Genet. 2012. PMID: 22156940 - Neuropathology in mouse models of mucopolysaccharidosis type I, IIIA and IIIB.
Wilkinson FL, Holley RJ, Langford-Smith KJ, Badrinath S, Liao A, Langford-Smith A, Cooper JD, Jones SA, Wraith JE, Wynn RF, Merry CL, Bigger BW. Wilkinson FL, et al. PLoS One. 2012;7(4):e35787. doi: 10.1371/journal.pone.0035787. Epub 2012 Apr 27. PLoS One. 2012. PMID: 22558223 Free PMC article. - Modeling neuronal defects associated with a lysosomal disorder using patient-derived induced pluripotent stem cells.
Lemonnier T, Blanchard S, Toli D, Roy E, Bigou S, Froissart R, Rouvet I, Vitry S, Heard JM, Bohl D. Lemonnier T, et al. Hum Mol Genet. 2011 Sep 15;20(18):3653-66. doi: 10.1093/hmg/ddr285. Epub 2011 Jun 17. Hum Mol Genet. 2011. PMID: 21685203 - Golgi requires a new casting in the screenplay of mucopolysaccharidosis II cytopathology.
Molnár K, Kobolák J, Dinnyés A. Molnár K, et al. Biol Futur. 2022 Mar;73(1):31-42. doi: 10.1007/s42977-021-00107-y. Epub 2021 Nov 27. Biol Futur. 2022. PMID: 34837645 Review. - Membrane traffic: a glitch in the Golgi matrix.
Short B, Barr FA. Short B, et al. Curr Biol. 2003 Apr 15;13(8):R311-3. Curr Biol. 2003. PMID: 12699642 Review.
Cited by
- Mucopolysaccharidoses: Cellular Consequences of Glycosaminoglycans Accumulation and Potential Targets.
Leal AF, Benincore-Flórez E, Rintz E, Herreño-Pachón AM, Celik B, Ago Y, Alméciga-Díaz CJ, Tomatsu S. Leal AF, et al. Int J Mol Sci. 2022 Dec 28;24(1):477. doi: 10.3390/ijms24010477. Int J Mol Sci. 2022. PMID: 36613919 Free PMC article. Review. - Patient iPSC-derived neural stem cells exhibit phenotypes in concordance with the clinical severity of mucopolysaccharidosis I.
Swaroop M, Brooks MJ, Gieser L, Swaroop A, Zheng W. Swaroop M, et al. Hum Mol Genet. 2018 Oct 15;27(20):3612-3626. doi: 10.1093/hmg/ddy259. Hum Mol Genet. 2018. PMID: 30052969 Free PMC article. - Unfolded protein response is not activated in the mucopolysaccharidoses but protein disulfide isomerase 5 is deregulated.
Villani GR, Chierchia A, Di Napoli D, Di Natale P. Villani GR, et al. J Inherit Metab Dis. 2012 May;35(3):479-93. doi: 10.1007/s10545-011-9403-8. Epub 2011 Oct 15. J Inherit Metab Dis. 2012. PMID: 22002444 - Metabolic rewiring and autophagy inhibition correct lysosomal storage disease in mucopolysaccharidosis IIIB.
Scarcella M, Scerra G, Ciampa M, Caterino M, Costanzo M, Rinaldi L, Feliciello A, Anzilotti S, Fiorentino C, Renna M, Ruoppolo M, Pavone LM, D'Agostino M, De Pasquale V. Scarcella M, et al. iScience. 2024 Jan 29;27(3):108959. doi: 10.1016/j.isci.2024.108959. eCollection 2024 Mar 15. iScience. 2024. PMID: 38361619 Free PMC article. - Unraveling the Multifaceted Role of the Golgi Apparatus: Insights into Neuronal Plasticity, Development, Neurogenesis, Alzheimer's Disease, and SARS-CoV-2 Interactions.
Toader C, Eva L, Covache-Busuioc RA, Costin HP, Glavan LA, Corlatescu AD, Ciurea AV. Toader C, et al. Brain Sci. 2023 Sep 23;13(10):1363. doi: 10.3390/brainsci13101363. Brain Sci. 2023. PMID: 37891732 Free PMC article. Review.
References
- Sardiello M, Palmieri M, di Ronza A, Medina DL, Valenza M, Gennarino VA, Di Malta C, Donaudy F, Embrione V, Polishchuk RS, Banfi S, Parenti G, Cattaneo E, Ballabio A. A gene network regulating lysosomal biogenesis and function. Science. 2009;325:473–477. - PubMed
- Cao Y, Espinola JA, Fossale E, Massey AC, Cuervo AM, MacDonald ME, Cotman SL. Autophagy is disrupted in a knock-in mouse model of juvenile neuronal ceroid lipofuscinosis. J Biol Chem. 2006;281:20483–20493. - PubMed
- Pacheco CD, Kunkel R, Lieberman AP. Autophagy in Niemann–Pick C disease is dependent upon Beclin-1 and responsive to lipid trafficking defects. Hum Mol Genet. 2007;16:1495–1503. - PubMed
Publication types
MeSH terms
Substances
LinkOut - more resources
Full Text Sources
Other Literature Sources
Molecular Biology Databases
Miscellaneous
