The Atlas of human African trypanosomiasis: a contribution to global mapping of neglected tropical diseases - PubMed (original) (raw)
The Atlas of human African trypanosomiasis: a contribution to global mapping of neglected tropical diseases
Pere P Simarro et al. Int J Health Geogr. 2010.
Abstract
Background: Following World Health Assembly resolutions 50.36 in 1997 and 56.7 in 2003, the World Health Organization (WHO) committed itself to supporting human African trypanosomiasis (HAT)-endemic countries in their efforts to remove the disease as a public health problem. Mapping the distribution of HAT in time and space has a pivotal role to play if this objective is to be met. For this reason WHO launched the HAT Atlas initiative, jointly implemented with the Food and Agriculture Organization of the United Nations, in the framework of the Programme Against African Trypanosomosis.
Results: The distribution of HAT is presented for 23 out of 25 sub-Saharan countries having reported on the status of sleeping sickness in the period 2000-2009. For the two remaining countries, i.e. Angola and the Democratic Republic of the Congo, data processing is ongoing. Reports by National Sleeping Sickness Control Programmes (NSSCPs), Non-Governmental Organizations (NGOs) and Research Institutes were collated and the relevant epidemiological data were entered in a database, thus incorporating (i) the results of active screening of over 2.2 million people, and (ii) cases detected in health care facilities engaged in passive surveillance. A total of over 42 000 cases of HAT and 6 000 different localities were included in the database. Various sources of geographic coordinates were used to locate the villages of epidemiological interest. The resulting average mapping accuracy is estimated at 900 m.
Conclusions: Full involvement of NSSCPs, NGOs and Research Institutes in building the Atlas of HAT contributes to the efficiency of the mapping process and it assures both the quality of the collated information and the accuracy of the outputs. Although efforts are still needed to reduce the number of undetected and unreported cases, the comprehensive, village-level mapping of HAT control activities over a ten-year period ensures a detailed and reliable representation of the known geographic distribution of the disease. Not only does the Atlas serve research and advocacy, but, more importantly, it provides crucial evidence and a valuable tool for making informed decisions to plan and monitor the control of sleeping sickness.
Figures
Figure 1
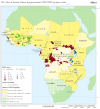
The Atlas of human African trypanosomiasis: progress status. For each country, data processing is considered complete when all available data sources for the study period (2000-2009) have been analysed and included in the HAT database.
Figure 2
Cases of human African trypanosomiasis reported from Western Africa (period 2000-2009). Countries masked in white are (i) non-endemic for HAT, or (ii) those that did not report on the HAT epidemiological situation in the period 2000-2009. Areas masked in grey correspond to disputed territories and non-self-governing territories [39].
Figure 3
Cases of human African trypanosomiasis reported from Central Africa (period 2000-2009). Countries masked in white are (i) those where mapping is in progress, (ii) those that did not report on the HAT epidemiological situation in the period 2000-2009.
Figure 4
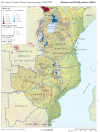
Cases of human African trypanosomiasis reported from Eastern and South-eastern Africa (period 2000-2009). Countries masked in white are (i) those were mapping is in progress, (ii) non-endemic for HAT, and (iii) those that did not report on the HAT epidemiological situation in the period 2000-2009.
Figure 5
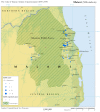
Cases of human African trypanosomiasis (T. b. rhodesiense) reported from the Nkhotakota focus in Malawi (period 2000-2009). Autochthonous cases are mapped in their places of residence. One exported case is mapped in the centroid of the polygon representing the park's boundaries.
Figure 6
HAT focus of Bodo in Chad (period 2005-2009). A: Villages where HAT cases were detected through passive surveillance (lilac circles) and villages where active case-finding activities were carried out (black dots). B: Disease stage ratio (S1: first stage, S2: second stage)
Figure 7
HAT focus of Mbini in Equatorial Guinea (period 2000-2009). Villages reporting HAT cases (red circles) and villages where active case-finding surveys were carried out (black dots).
Similar articles
- The elimination of human African trypanosomiasis: Achievements in relation to WHO road map targets for 2020.
Franco JR, Cecchi G, Paone M, Diarra A, Grout L, Kadima Ebeja A, Simarro PP, Zhao W, Argaw D. Franco JR, et al. PLoS Negl Trop Dis. 2022 Jan 18;16(1):e0010047. doi: 10.1371/journal.pntd.0010047. eCollection 2022 Jan. PLoS Negl Trop Dis. 2022. PMID: 35041668 Free PMC article. - Control and surveillance of human African trypanosomiasis.
World Health Organization. World Health Organization. World Health Organ Tech Rep Ser. 2013;(984):1-237. World Health Organ Tech Rep Ser. 2013. PMID: 24552089 - The elimination of human African trypanosomiasis: Monitoring progress towards the 2021-2030 WHO road map targets.
Franco JR, Priotto G, Paone M, Cecchi G, Ebeja AK, Simarro PP, Sankara D, Metwally SBA, Argaw DD. Franco JR, et al. PLoS Negl Trop Dis. 2024 Apr 16;18(4):e0012111. doi: 10.1371/journal.pntd.0012111. eCollection 2024 Apr. PLoS Negl Trop Dis. 2024. PMID: 38626188 Free PMC article. - Tsetse Flies (Glossina) as Vectors of Human African Trypanosomiasis: A Review.
Wamwiri FN, Changasi RE. Wamwiri FN, et al. Biomed Res Int. 2016;2016:6201350. doi: 10.1155/2016/6201350. Epub 2016 Feb 29. Biomed Res Int. 2016. PMID: 27034944 Free PMC article. Review. - Controlling sleeping sickness - a review.
Welburn SC, Maudlin I, Simarro PP. Welburn SC, et al. Parasitology. 2009 Dec;136(14):1943-9. doi: 10.1017/S0031182009006416. Epub 2009 Aug 20. Parasitology. 2009. PMID: 19691861 Review.
Cited by
- Apolipoprotein-1 risk variants and associated kidney phenotypes in an adult HIV cohort in Nigeria.
Wudil UJ, Aliyu MH, Prigmore HL, Ingles DJ, Ahonkhai AA, Musa BM, Muhammad H, Sani MU, Nalado AM, Abdu A, Abdussalam K, Shepherd BE, Dankishiya FS, Burgner AM, Ikizler TA, Wyatt CM, Kopp JB, Kimmel PL, Winkler CA, Wester CW. Wudil UJ, et al. Kidney Int. 2021 Jul;100(1):146-154. doi: 10.1016/j.kint.2021.03.038. Epub 2021 Apr 24. Kidney Int. 2021. PMID: 33901548 Free PMC article. - The effect of livestock density on Trypanosoma brucei gambiense and T. b. rhodesiense: A causal inference-based approach.
Meisner J, Kato A, Lemerani MM, Mwamba Miaka E, Ismail Taban A, Wakefield J, Rowhani-Rahbar A, Pigott DM, Mayer JD, Rabinowitz PM. Meisner J, et al. PLoS Negl Trop Dis. 2022 Aug 29;16(8):e0010155. doi: 10.1371/journal.pntd.0010155. eCollection 2022 Aug. PLoS Negl Trop Dis. 2022. PMID: 36037205 Free PMC article. - Need of entomological criteria to assess zero transmission of gambiense HAT.
Solano P. Solano P. PLoS Negl Trop Dis. 2021 Mar 25;15(3):e0009235. doi: 10.1371/journal.pntd.0009235. eCollection 2021 Mar. PLoS Negl Trop Dis. 2021. PMID: 33765067 Free PMC article. Review. No abstract available. - A Primate APOL1 Variant That Kills Trypanosoma brucei gambiense.
Cooper A, Capewell P, Clucas C, Veitch N, Weir W, Thomson R, Raper J, MacLeod A. Cooper A, et al. PLoS Negl Trop Dis. 2016 Aug 5;10(8):e0004903. doi: 10.1371/journal.pntd.0004903. eCollection 2016 Aug. PLoS Negl Trop Dis. 2016. PMID: 27494254 Free PMC article. - Large-scale spatial population databases in infectious disease research.
Linard C, Tatem AJ. Linard C, et al. Int J Health Geogr. 2012 Mar 20;11:7. doi: 10.1186/1476-072X-11-7. Int J Health Geogr. 2012. PMID: 22433126 Free PMC article. Review.
References
- Remme J, Feenstra P, Lever P, Médici A, Morel C, Noma M, Ramaiah K, Richards F, Seketeli A, Schmunis G. Tropical diseases targeted for elimination: Chagas disease, lymphatic filariasis, onchocerciasis, and leprosy. A custom publication of the Disease Control Priorities Project. 2006. p. 147.http://files.dcp2.org/pdf/DCP/DCP22.pdf
- World Health Organization. Global plan to combat neglected tropical diseases 2008-2015. Geneva; 2007. http://whqlibdoc.who.int/hq/2007/WHO_CDS_NTD_2007.3_eng.pdf
Publication types
MeSH terms
LinkOut - more resources
Full Text Sources
Miscellaneous


