On the shape and fabric of human history - PubMed (original) (raw)
Comparative Study
On the shape and fabric of human history
Russell D Gray et al. Philos Trans R Soc Lond B Biol Sci. 2010.
Abstract
In this paper we outline two debates about the nature of human cultural history. The first focuses on the extent to which human history is tree-like (its shape), and the second on the unity of that history (its fabric). Proponents of cultural phylogenetics are often accused of assuming that human history has been both highly tree-like and consisting of tightly linked lineages. Critics have pointed out obvious exceptions to these assumptions. Instead of a priori dichotomous disputes about the validity of cultural phylogenetics, we suggest that the debate is better conceptualized as involving positions along continuous dimensions. The challenge for empirical research is, therefore, to determine where particular aspects of culture lie on these dimensions. We discuss the ability of current computational methods derived from evolutionary biology to address these questions. These methods are then used to compare the extent to which lexical evolution is tree-like in different parts of the world and to evaluate the coherence of cultural and linguistic lineages.
Figures
Figure 1.
This figure positions linguistic traits on three dimensions. _R_v is the rate of change of vertically inherited cultural traits, _R_h is the rate of horizontal transmission and C is the degree of cultural cohesion (adapted from Gray et al. (2007)). In this hypothetical example, morpho-syntactical traits evolved slowly, are relatively rarely borrowed and are tightly bound together. In contrast, a random sampling of the total lexicon evolves rapidly, has lots of borrowing and reflects many different cultural histories.
Figure 2.
A quartet containing the taxa i, j, k and l. The path-length from taxon i to taxon j is the sum of branches a, b and c.
Figure 3.
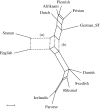
A split graph showing the results of a NeighborNet analysis of 12 Indo-European languages. The graph shows strong conflicting signal for the positioning of Sranan. The split labelled (a) with the short-dashed line groups Sranan most closely with English, while the other one labelled (b) with the long-dashed line groups Sranan with Dutch and other closely related Germanic languages. Scale bar, 0.01.
Figure 4.
A split graph showing the results of NeighborNet analyses of the Polynesian lexical data. The network has three main regions: Fijian dialects plus Rotuman, western Polynesian and Eastern Polynesian. There is substantial conflicting signal within each region consistent with the break-up of a dialect chain. Scale bar, 0.1.
Figure 5.
A split graph showing the results of NeighborNet analyses of the Indo-European lexical data. Scale bar, 0.1.
Figure 6.
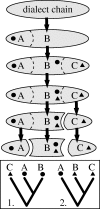
A diagram showing the problem dialect chains cause for the construction of bifurcating trees. The dialects A, B and C are initially all mutually intelligible (note the permeable boundaries between the dialects). Innovations evolve in these dialects (filled circles; filled triangles) and diffuse through the network. However, if a dialect splits off from the network (e.g. the split between C and the other two languages), and this diffusion is only partially complete, then conflicting character histories can result. The filled circle characters support topology 1, whereas the filled triangle characters support topology 2. So, under the Dialect Chain/Network-Breaking model, areas where dialect chains were present should be poorly resolved in a phylogenetic analysis, and are better represented by a network diagram rather than a tree.
Figure 7.
Split graphs showing the results of NeighborNet analyses of the lexical and typological data. The analyses used Hamming distances and splits were filtered to a threshold of 0.001. For Austronesian basic vocabulary, the average delta score was 0.33 and the average _Q_-residual = 0.0020. The average delta score for Austronesian typological data was 0.44 and the average _Q_-residual = 0.05. The respective figures for Indo-European were 0.21 and 0.001 (basic vocabulary) and 0.40 and 0.04 (typology). Known subgroups within each language family are colour-coded. Scale bar, 0.01.
Figure 8.
Maximum clade credibility language tree for the 11 societies analysed by Rogers et al. The tree is constructed from basic vocabulary data with the analyses constrained on the basis of phonological and morphological innovations. To match languages to cultures, we assumed that Societies = Tahitian, Australs = Rurutuan, Cooks = Rarotongan.
Figure 9.
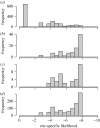
Histograms showing the distribution of likelihood scores for (a) basic vocabulary, (b) functional aspects of canoe design, (c) symbolic aspects of canoe design and (d) randomization of the canoe data on the language tree. Likelihood scores close to zero indicate a good fit. The basic vocabulary data fit the tree the best (mean = −2.89, median = −2.89, s.d. = 2.31). Both the functional and symbolic aspects of canoe design are close to the random distribution (functional: mean = −6.64, median = −7.36, s.d. = 1.28; symbolic: mean = −6.13, median = −6.34, s.d. = 1.37; random: mean = −6.30, median = −6.92, s.d. = 1.45).
Figure 10.
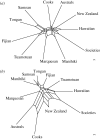
Split graphs showing the results of NeighborNet analyses of the (a) functional and (b) the symbolic aspects of canoe design. For functional traits, the average delta score was 0.46 and the average _Q_-residual = 0.03. For symbolic traits, the average delta score was 0.37 and the average _Q_-residual = 0.05. Scale bar, 0.01.
Similar articles
- Ethics of Procuring and Using Organs or Tissue from Infants and Newborns for Transplantation, Research, or Commercial Purposes: Protocol for a Bioethics Scoping Review.
Barış M, Lim X, T Almonte M, Shaw D, Brierley J, Porsdam Mann S, Nguyen T, Menikoff J, Wilkinson D, Savulescu J, Earp BD. Barış M, et al. Wellcome Open Res. 2024 Dec 5;9:717. doi: 10.12688/wellcomeopenres.23235.1. eCollection 2024. Wellcome Open Res. 2024. PMID: 39839977 Free PMC article. - Depressing time: Waiting, melancholia, and the psychoanalytic practice of care.
Salisbury L, Baraitser L. Salisbury L, et al. In: Kirtsoglou E, Simpson B, editors. The Time of Anthropology: Studies of Contemporary Chronopolitics. Abingdon: Routledge; 2020. Chapter 5. In: Kirtsoglou E, Simpson B, editors. The Time of Anthropology: Studies of Contemporary Chronopolitics. Abingdon: Routledge; 2020. Chapter 5. PMID: 36137063 Free Books & Documents. Review. - Qualitative evidence synthesis informing our understanding of people's perceptions and experiences of targeted digital communication.
Ryan R, Hill S. Ryan R, et al. Cochrane Database Syst Rev. 2019 Oct 23;10(10):ED000141. doi: 10.1002/14651858.ED000141. Cochrane Database Syst Rev. 2019. PMID: 31643081 Free PMC article. - Body Image Distortion (Archived).
Hosseini SA, Padhy RK. Hosseini SA, et al. 2023 Sep 4. In: StatPearls [Internet]. Treasure Island (FL): StatPearls Publishing; 2025 Jan–. 2023 Sep 4. In: StatPearls [Internet]. Treasure Island (FL): StatPearls Publishing; 2025 Jan–. PMID: 31536191 Free Books & Documents. - A scoping review of transcription-less practices for analysis of aphasic discourse and implications for future research.
Stark BC, Dalton SG. Stark BC, et al. Int J Lang Commun Disord. 2024 Sep-Oct;59(5):1734-1762. doi: 10.1111/1460-6984.13028. Epub 2024 Mar 23. Int J Lang Commun Disord. 2024. PMID: 38520735
Cited by
- The uses and abuses of tree thinking in cultural evolution.
Evans CL, Greenhill SJ, Watts J, List JM, Botero CA, Gray RD, Kirby KR. Evans CL, et al. Philos Trans R Soc Lond B Biol Sci. 2021 Jul 5;376(1828):20200056. doi: 10.1098/rstb.2020.0056. Epub 2021 May 17. Philos Trans R Soc Lond B Biol Sci. 2021. PMID: 33993767 Free PMC article. Review. - Population structure and cultural geography of a folktale in Europe.
Ross RM, Greenhill SJ, Atkinson QD. Ross RM, et al. Proc Biol Sci. 2013 Feb 6;280(1756):20123065. doi: 10.1098/rspb.2012.3065. Print 2013 Apr 7. Proc Biol Sci. 2013. PMID: 23390109 Free PMC article. - Bayesian phylogenetic analysis supports an agricultural origin of Japonic languages.
Lee S, Hasegawa T. Lee S, et al. Proc Biol Sci. 2011 Dec 22;278(1725):3662-9. doi: 10.1098/rspb.2011.0518. Epub 2011 May 4. Proc Biol Sci. 2011. PMID: 21543358 Free PMC article. - The structure of cross-cultural musical diversity.
Rzeszutek T, Savage PE, Brown S. Rzeszutek T, et al. Proc Biol Sci. 2012 Apr 22;279(1733):1606-12. doi: 10.1098/rspb.2011.1750. Epub 2011 Nov 9. Proc Biol Sci. 2012. PMID: 22072606 Free PMC article. - Extracting hierarchical features of cultural variation using network-based clustering.
Liu X, Rosenberg NA, Greenbaum G. Liu X, et al. Evol Hum Sci. 2022;4:e18. doi: 10.1017/ehs.2022.15. Epub 2022 May 2. Evol Hum Sci. 2022. PMID: 36276878 Free PMC article.
References
- Atkinson Q. D., Gray R. D.2005Curious parallels and curious connections: phylogenetic thinking in biology and historical linguistics. Syst. Biol. 54, 513–526 (doi:10.1080/10635150590950317) - DOI - PubMed
- Atkinson Q. D., Nicholls G., Welch D., Gray R. D.2005From words to dates: water into wine, mathemagic or phylogenetic inference? Trans. Philol. Soc. 103, 193–219 (doi:10.1111/j.1467-968X.2005.00151.x) - DOI
- Bandelt H., Dress A. W. M.1992Split decomposition: a new and useful approach to phylogenetic analysis of distance data. Mol. Phylogenet. Evol. 1, 242–252 (doi:10.1016/1055-7903(92)90021-8) - DOI - PubMed
- Borgerhoff Mulder M., Nunn C. L., Towner M. C.2006Cultural macroevolution and the transmission of traits. Evol. Anthropol. 15, 52–64 (doi:10.1002/evan.20088) - DOI
- Boyd R., Borgerhoff Mulder M., Durham W. H., Richerson P. J.1997Are cultural phylogenies possible? In Human by nature, between biology and the social sciences (eds Weingart P., Richerson P. J., Mitchell S. D., Maasen S.), pp. 355–386 Mahwah, NJ: Lawrence Erlbaum Associates
Publication types
MeSH terms
LinkOut - more resources
Full Text Sources


