Ubiquitin accumulation in autophagy-deficient mice is dependent on the Nrf2-mediated stress response pathway: a potential role for protein aggregation in autophagic substrate selection - PubMed (original) (raw)
. 2010 Nov 1;191(3):537-52.
doi: 10.1083/jcb.201005012.
Stephen E Kaiser, Thomas A Shaler, Aylwin C Y Ng, Taichi Hara, Mark S Hipp, Kasper Lage, Ramnik J Xavier, Kwon-Yul Ryu, Keiko Taguchi, Masayuki Yamamoto, Keiji Tanaka, Noboru Mizushima, Masaaki Komatsu, Ron R Kopito
Affiliations
- PMID: 21041446
- PMCID: PMC3003313
- DOI: 10.1083/jcb.201005012
Ubiquitin accumulation in autophagy-deficient mice is dependent on the Nrf2-mediated stress response pathway: a potential role for protein aggregation in autophagic substrate selection
Brigit E Riley et al. J Cell Biol. 2010.
Abstract
Genetic ablation of autophagy in mice leads to liver and brain degeneration accompanied by the appearance of ubiquitin (Ub) inclusions, which has been considered to support the hypothesis that ubiquitination serves as a cis-acting signal for selective autophagy. We show that tissue-specific disruption of the essential autophagy genes Atg5 and Atg7 leads to the accumulation of all detectable Ub-Ub topologies, arguing against the hypothesis that any particular Ub linkage serves as a specific autophagy signal. The increase in Ub conjugates in Atg7(-/-) liver and brain is completely suppressed by simultaneous knockout of either p62 or Nrf2. We exploit a novel assay for selective autophagy in cell culture, which shows that inactivation of Atg5 leads to the selective accumulation of aggregation-prone proteins, and this does not correlate with an increase in substrate ubiquitination. We propose that protein oligomerization drives autophagic substrate selection and that the accumulation of poly-Ub chains in autophagy-deficient circumstances is an indirect consequence of activation of Nrf2-dependent stress response pathways.
Figures
Figure 1.
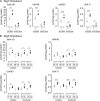
Accumulation of Ub in autophagy-deficient brain. Ub profile from the 1% Triton X-100–soluble and –insoluble fraction of autophagy-deficient brain homogenates captured with P2UBA resin. (A) Age-matched control Atg7 littermates (Atg7flox/+;nestin-Cre:p62+/−; denoted +) at 6 wk (open circles; n = 4) or Atg7 KO (Atg7flox/flox;nestin-Cre:p62+/−; denoted −) at 6 wk (closed diamonds; n = 3) are shown. (B) Control Atg5 littermates (Atg5flox/+;nestin-Cre; denoted +) at 16 (open circles; n = 4) and 26 wk (open diamonds; n = 3) or Atg5 KO (Atg5flox/flox;nestin-Cre; denoted −) at 16 (closed circles; n = 4) and 26 wk (closed diamonds; n = 3) are shown. Each symbol represents one animal. *, P ≤ 0.05; **, P ≤ 0.01; ***, P ≤ 0.005.
Figure 2.
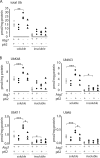
Suppressed accumulation of Ub in _Atg7_-/_p62_-deficient brains. (A and B) Quantitative mass spectrometry analysis of P2UBA captured total (A) and isopeptide-linked (B) Ub from the soluble and insoluble fractions of autophagy-deficient brains. Age-matched control Atg7 littermates (Atg7flox/+:nestin-Cre:p62+/−; denoted +) at 6 wk (open circles; n = 4), p62 KO (Atg7flox/flox:p62−/−; denoted −) at 6 wk (closed circles; n = 3), Atg7 KO (Atg7flox/flox:nestin-Cre:p62+/−; denoted −) at 6 wk (closed diamonds; n = 3), or _Atg7_-/_p62_-DKO (Atg7flox/flox:nestin-Cre:p62−/−) at 6 wk (closed triangles; n = 3) are shown. Each symbol represents one animal. *, P ≤ 0.05; **, P ≤ 0.01; ***, P ≤ 0.005.
Figure 3.
Suppressed accumulation of Ub in _Atg7_-/_Nrf2_-deficient livers. (A and B) Quantitative mass spectrometry analysis of P2UBA captured p62 (A), total (A), and isopeptide-linked (B) Ub from the soluble and insoluble fraction of autophagy-deficient livers (28 d after pIpC injection). Control littermates (F/F or F/F:Nrf2+/−; denoted +; open circles; n = 4), Nrf2 KO (F/F:Nrf2−/−; denoted −; closed circles; n = 4), Atg7 KO (F/F:Mx1 or F/F:Mx1:Nrf2+/−; denoted −; closed diamonds; n = 6), or _Atg7_-/_Nrf2_-DKO (F/F:Mx1:Nrf2−/−; closed triangles; n = 6) are shown. Each symbol represents one animal. **, P ≤ 0.01; ***, P ≤ 0.005.
Figure 4.
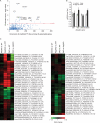
Nrf2 transcription factor–binding sites are enriched among Ub-associated genes. (A) Enrichment of predicted transcription factor (TF)–binding sites in the promoter region (−5,000 to 300) of Ub-associated genes versus its representation genome wide. The top 10 most enriched transcription factor–binding sites predicted among Ub-associated genes are labeled, with their enrichment scores (or −Log10–transformed Benjamini–Hochberg-adjusted p-values) plotted against its occurrence. (B) Elevated Ub mRNA levels from _Atg5_-deficient brains. Total RNA was extracted from control Atg5 littermates (Atg5flox/+;nestin-Cre) at 16 wk or Atg5 KO (Atg5flox/flox;nestin-Cre) at 16 wk (n = 4 for each genotype; **, P ≤ 0.01) and the amount of transcript from Ubc, Ubb, Uba52, and Uba80 genes was quantified using real-time RT-PCR and normalized to actin. Error bars indicate SEM. au, arbitrary unit. (C) Gene expression analysis of Ub-associated Nrf2 targets mapped to mouse orthologues. Probes detecting transcripts exhibiting differential expression (Benjamini–Hochberg-adjusted P < 0.05) in at least one of the four comparisons are shown. Heat map represents Log2 (fold changes) with respect to either wild type (WT) or Atg7 KO (as indicated). Labels show the symbol, RefSeq (accession numbers from the NCBI Nucleotide database), gene probe name, and the gene row and gene column (i.e., array coordinates).
Figure 5.
Ub-associated Nrf2 targets are enriched in the autophagy network. (A) A second-order network centered on the core autophagy components (orange nodes) identified via PPIs showed an enrichment (hypergeometric P = 0.01) of Ub-associated Nrf2 targets (red nodes) in the network. (B) Venn diagram showing the various counts and overlaps between the microarray and network analysis. Also shown are the Ub-associated Nrf2 targets featured in the autophagy network mapped to mouse orthologues. Probes detecting transcripts exhibiting differential expression (Benjamini–Hochberg [BH]-adjusted P < 0.05) in at least one of the four comparisons are shown. Heat map represents Log2 (fold changes) with respect to either wild type (WT) or Atg7 KO (as indicated). Labels show the symbol, RefSeq (accession numbers from the NCBI Nucleotide database), gene probe name, and the gene row and gene column (i.e., array coordinates).
Figure 6.
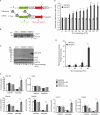
Flow cytometry assay to quantify selective autophagy. (A) Diagram of the bicistronic reporter construct. Ribosomes are recruited to both the 5′ end of the bicistronic construct to translate the test fusion protein fused to GFP and at the IRES to translate the stable, nonaggregating reference protein chFP. The test protein is either htt exon 1 with a nonpathogenic poly-Gln repeat htt(Q25) fused to GFP or htt with an expanded poly-Gln tract, htt(Q47)-GFP, which promotes aggregation. (B) The addition of dox for 96 h decreased autophagy in the bicistronic stably expressing cell lines similar to the parental line, m5-7, as measured by the decreased levels of phosphatidylethanolamine-modified LC3 (LC3-II). (C) Western blot (WB) analysis of the accumulation of htt(Q)-GFP after autophagy shutoff. At steady-state (t = 0 h), the levels of both htt(Q25)-GFP and htt(Q47)-GFP were virtually undetectable. After autophagy shutoff, there was a robust increase in the level of htt(Q47)-GFP, as detected by GFP Western blot, whereas there was very little or no detectable increase in htt(Q25)-GFP, GAPDH, LDH, or chFP. (D) Quantitative flow cytometry time course analysis measuring selective autophagy in live cells. The ASI is the ratio of the relative increase in green and red fluorescence, as assessed by two-color flow cytometry, in response to dox. In control experiments, the ASI of two soluble, nonaggregating proteins, htt(Q25)-GFP and chFP, was 1. In contrast, the ASI of the aggregation-prone protein, htt(Q47)-GFP, compared with chFP after autophagy shutoff (+dox; 100 h) was 2. Data represent three independent experiments performed on different days. **, P ≤ 0.01; ***, P ≤ 0.005. (E) Flow cytometry time course analysis of cell death at different time points after autophagy shutoff (+dox). The degree of cell death correlated directly with increased htt(Q47)-GFP levels after autophagy shutoff and was significantly enhanced in cells expressing htt(Q47)-GFP compared with htt(Q25)-GFP (***, P ≤ 0.005). Data represent three independent experiments performed on different days. (F) AQUA using heavy isotope–labeled GFP standard in addition to the routine Ub standards after P2UBA pull-down of soluble and insoluble lysates from htt(Q)-GFP-IRES-chFP bicistronic expressing cells before (−dox) and after autophagy shutoff (+dox). The experimental GFP peptide was only detected in two of the four experiments, and the data shown are representative of these. In the other two experiments, the experimental GFP peptide was below the threshold of detection. (D–F) Error bars indicate SEM. *, P ≤ 0.05; **, P ≤ 0.01; ***, P ≤ 0.005.
Similar articles
- Keap1 degradation by autophagy for the maintenance of redox homeostasis.
Taguchi K, Fujikawa N, Komatsu M, Ishii T, Unno M, Akaike T, Motohashi H, Yamamoto M. Taguchi K, et al. Proc Natl Acad Sci U S A. 2012 Aug 21;109(34):13561-6. doi: 10.1073/pnas.1121572109. Epub 2012 Aug 7. Proc Natl Acad Sci U S A. 2012. PMID: 22872865 Free PMC article. - The selective autophagy substrate p62 activates the stress responsive transcription factor Nrf2 through inactivation of Keap1.
Komatsu M, Kurokawa H, Waguri S, Taguchi K, Kobayashi A, Ichimura Y, Sou YS, Ueno I, Sakamoto A, Tong KI, Kim M, Nishito Y, Iemura S, Natsume T, Ueno T, Kominami E, Motohashi H, Tanaka K, Yamamoto M. Komatsu M, et al. Nat Cell Biol. 2010 Mar;12(3):213-23. doi: 10.1038/ncb2021. Epub 2010 Feb 21. Nat Cell Biol. 2010. PMID: 20173742 - Persistent activation of Nrf2 through p62 in hepatocellular carcinoma cells.
Inami Y, Waguri S, Sakamoto A, Kouno T, Nakada K, Hino O, Watanabe S, Ando J, Iwadate M, Yamamoto M, Lee MS, Tanaka K, Komatsu M. Inami Y, et al. J Cell Biol. 2011 Apr 18;193(2):275-84. doi: 10.1083/jcb.201102031. Epub 2011 Apr 11. J Cell Biol. 2011. PMID: 21482715 Free PMC article. - The Roles of Ubiquitin-Binding Protein Shuttles in the Degradative Fate of Ubiquitinated Proteins in the Ubiquitin-Proteasome System and Autophagy.
Zientara-Rytter K, Subramani S. Zientara-Rytter K, et al. Cells. 2019 Jan 10;8(1):40. doi: 10.3390/cells8010040. Cells. 2019. PMID: 30634694 Free PMC article. Review. - The exploitation of host autophagy and ubiquitin machinery by Mycobacterium tuberculosis in shaping immune responses and host defense during infection.
Shariq M, Quadir N, Alam A, Zarin S, Sheikh JA, Sharma N, Samal J, Ahmad U, Kumari I, Hasnain SE, Ehtesham NZ. Shariq M, et al. Autophagy. 2023 Jan;19(1):3-23. doi: 10.1080/15548627.2021.2021495. Epub 2022 Jan 9. Autophagy. 2023. PMID: 35000542 Free PMC article. Review.
Cited by
- Disruption of protein quality control in Parkinson's disease.
Cook C, Stetler C, Petrucelli L. Cook C, et al. Cold Spring Harb Perspect Med. 2012 May;2(5):a009423. doi: 10.1101/cshperspect.a009423. Cold Spring Harb Perspect Med. 2012. PMID: 22553500 Free PMC article. Review. - Ubiquitin receptors and protein quality control.
Wang X, Terpstra EJ. Wang X, et al. J Mol Cell Cardiol. 2013 Feb;55:73-84. doi: 10.1016/j.yjmcc.2012.09.012. Epub 2012 Oct 6. J Mol Cell Cardiol. 2013. PMID: 23046644 Free PMC article. Review. - Ubiquitin versus misfolding: The minimal requirements for inclusion body formation.
Dantuma NP, Salomons FA. Dantuma NP, et al. J Cell Biol. 2016 Apr 25;213(2):147-9. doi: 10.1083/jcb.201603095. J Cell Biol. 2016. PMID: 27114497 Free PMC article. - SQSTM1/p62: A Potential Target for Neurodegenerative Disease.
Ma S, Attarwala IY, Xie XQ. Ma S, et al. ACS Chem Neurosci. 2019 May 15;10(5):2094-2114. doi: 10.1021/acschemneuro.8b00516. Epub 2019 Apr 19. ACS Chem Neurosci. 2019. PMID: 30657305 Free PMC article. Review. - Genome-Wide CRISPR Screen Reveals Autophagy Disruption as the Convergence Mechanism That Regulates the NRF2 Transcription Factor.
Kerins MJ, Liu P, Tian W, Mannheim W, Zhang DD, Ooi A. Kerins MJ, et al. Mol Cell Biol. 2019 Jun 13;39(13):e00037-19. doi: 10.1128/MCB.00037-19. Print 2019 Jul 1. Mol Cell Biol. 2019. PMID: 31010806 Free PMC article.
References
Publication types
MeSH terms
Substances
LinkOut - more resources
Full Text Sources
Molecular Biology Databases


