Weight consistency specifies regularities of macaque cortical networks - PubMed (original) (raw)
. 2011 Jun;21(6):1254-72.
doi: 10.1093/cercor/bhq201. Epub 2010 Nov 2.
P Misery, A Falchier, C Lamy, J Vezoli, R Quilodran, M A Gariel, P Giroud, M Ercsey-Ravasz, L J Pilaz, C Huissoud, P Barone, C Dehay, Z Toroczkai, D C Van Essen, H Kennedy, K Knoblauch
Affiliations
- PMID: 21045004
- PMCID: PMC3097985
- DOI: 10.1093/cercor/bhq201
Weight consistency specifies regularities of macaque cortical networks
N T Markov et al. Cereb Cortex. 2011 Jun.
Abstract
To what extent cortical pathways show significant weight differences and whether these differences are consistent across animals (thereby comprising robust connectivity profiles) is an important and unresolved neuroanatomical issue. Here we report a quantitative retrograde tracer analysis in the cynomolgus macaque monkey of the weight consistency of the afferents of cortical areas across brains via calculation of a weight index (fraction of labeled neurons, FLN). Injection in 8 cortical areas (3 occipital plus 5 in the other lobes) revealed a consistent pattern: small subcortical input (1.3% cumulative FLN), high local intrinsic connectivity (80% FLN), high-input form neighboring areas (15% cumulative FLN), and weak long-range corticocortical connectivity (3% cumulative FLN). Corticocortical FLN values of projections to areas V1, V2, and V4 showed heavy-tailed, lognormal distributions spanning 5 orders of magnitude that were consistent, demonstrating significant connectivity profiles. These results indicate that 1) connection weight heterogeneity plays an important role in determining cortical network specificity, 2) high investment in local projections highlights the importance of local processing, and 3) transmission of information across multiple hierarchy levels mainly involves pathways having low FLN values.
Figures
Figure 1.
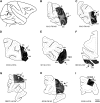
Injection sites. (A) Injection sites indicated on a lateral view of a cerebral hemisphere. For case numbers, see Table 1. (B)—I B: V1, (C) V2, (D) V4, (E) TEO, (F) 7A, (G) 8, (H) F5, (I) 9/46d. A plot map is overlaid on photomontage of Nissl stain (objective ×10) for each injection site. Sections are coronal plane except (F), which is a horizontal section. Uptake zones are indicated by arrows. Scale bar = 5 mm. Relevant sulci abbreviations are indicated and full names can be found in the abbreviation index table.
Figure 2.
Intrinsic and extrinsic connectivity. (A) Intrinsic FLNt values of 9 areas. V1 and V4 are averages for repeated injections. (B) Exponential decay of density of intrinsic neurons with distance following injection in area V1. (C) Distances within which the 3 thresholds (75%, 80%, and 95%) of intrinsic FLNt are attained in 7 injected areas. Dashed lines indicate mean distance at which each threshold is reached. Error bars are SD.
Figure 3.
FLNt values of cortical and subcortical projections. (A) Mean cumulated FLNt of 4 projection classes. Intrinsic: intrinsic; short: projection from immediate neighbors; long: all the remaining corticocortical projections to the target area; SC: subcortical projections. Error bars indicate the SD. (B) Mean FLNt of the subcortical structures projecting on V1, V2, and V4. Error bars are SD. LGN, lateral geniculate nucleus; Pul, pulvinar nucleus; Cl, claustrum; Amyg, amygdala complex. For area definitions and terminology, see
Figure S6
and abbreviations list in Table 4.
Figure 4.
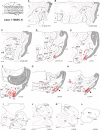
Injection in central V1. Upper left: section levels indicated on a lateral view of a cerebral hemisphere. (A_–_L) Horizontal charts of retrograde-labeled neurons following injection of DY in area V1. Shading indicates the extent of area V1. The injection site is identified as a red point. Projecting neurons are in red. Empty black rectangle indicates neurons from an adjacent section projected on the mapped section.
Figure 5.
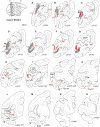
Injection in central V2. Upper left: section levels indicated on a lateral view of a cerebral hemisphere. (A_–_O) Coronal charts of retrograde-labeled neurons following injection of DY in V2. Empty black rectangle indicates neurons from an adjacent section projected on the mapped section.
Figure 6.
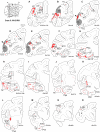
Injection in central V4. Upper left: section levels indicated on a lateral view of a cerebral hemisphere. (A_–_O) Coronal charts of retrograde label neurons following injection of DY in V2. Empty black rectangle indicates neurons from an adjacent section projected on the mapped section.
Figure 7.
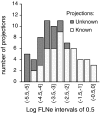
FLN distribution of known and unknown connections. Distribution of previously documented (i.e., known) and undocumented (i.e., unknown) projections as a function of projection magnitude (FLNe) at intervals of 0.5 log generated after the injection of areas V1, V2, and V4. Areas and their FLN values are listed in
Supplementary Table S1
.
Figure 8.
Modeling FLN variance. (A) FLNe SD as a function of the mean; green curve, negative binomial; θ, dispersion parameter of cortical projections; brackets, 95% confidence interval; blue, geometric distribution; red, Poisson distribution. The estimated SD will tend to be biased for the largest FLNe values as the upper limit of 1 is approached. This accounts for the downturn in the curves of SD vs mean FLNe at large FLNe values. (B) Distribution symmetry as measured by the median/mean as a function of FLNe for area V1; green circle and error bars, mean and 95% confidence interval (0.87, 0.97); red line, log(2), limiting value for geometric distribution; black dashed line, a symmetric distribution; green dashed line (0.96), negative binomial distribution.
Figure 9.
Effect of segmentation on variance. (A, B, C) The SD as a function of the mean of the FLNe for the individual projections to V1, V2, and V4, respectively. The estimated overdispersion is similar across each injection site. (E, F, G) The mean/SD relation for the FLNt values pooled into 7 large regions where areas with disputable limits are fused. V1, V2, ventral pathway, dorsal pathway, frontal, subcortical excluding the thalamus. Such pooling that would minimize variability that might occur from errors in segmenting cortical regions produces only minor improvements in the overdispersion of the data. For color codes, symbols, and other conventions, see Figure 8.
Figure 10.
Within-individual analysis of variance. SD as a function of the mean of the FLNe. (A) area V1; (B) area V2. For color codes, symbols, and other conventions, see Figure 8.
Figure 11.
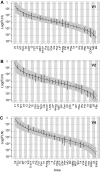
Lognormal distribution of FLN values. The observed means (points) ordered by magnitude and SDs (error bars) of the logarithm of the FLNe for the cortical areas projecting on injection sites. (A) V1 (n = 5), (B) V2 (n = 3), and (C) V4 (n = 3). The relative variability increases as the size of the projection decreases. Over most of the range, the variability is less than an order of magnitude. The curves are the expected lognormal distribution for an ordered sample of size, n, equal to the number of source areas. The gray envelope around each curve indicates the 0.025 and 0.975 quantiles obtained by resampling n points from a lognormal distribution 10 000 times and ordering them.
Figure 12.
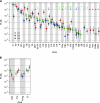
Connectivity profiles of areas V1, V2, and V4. (A) Extrinsic FLNe values of cortical projections and 95% confidence intervals for V1 (green), V2 (blue), and V4 (red) as estimated with a negative binomial model. Stars: new previously undocumented projections. (B) Mean log FLNe of subcortical projections with SDs. For other conventions, see Figure 8.
Figure 13.
Connectivity profiles mapped to a surface-based macaque atlas. (A) A set of 82 cortical areas represented on the M129 right hemisphere reconstructed from section drawings (
Supplementary Fig. S6
) and displayed on lateral and medial views of the 3D anatomical surface. (B) The same set of areas mapped to the F99 macaque atlas (Van Essen 2002b) and displayed on lateral and medial views of the 3D anatomical surface. (C) The 3D anatomical surface on inflated lateral and medial view of the brain hemisphere and flat map of the areal limits. (D) Average connectivity maps for V1 (top), V2 (middle), and V4 (bottom) displayed on inflated atlas surfaces and a cortical flat maps using a logarithmic scale to represent the range of connection strengths. Injected areas are colored in black. The data sets associated with these results are available at
http://sumsdb.wustl.edu/sums/directory.do?id=8280575&dir\_name=MARKOV\_CC10
.
Similar articles
- A weighted and directed interareal connectivity matrix for macaque cerebral cortex.
Markov NT, Ercsey-Ravasz MM, Ribeiro Gomes AR, Lamy C, Magrou L, Vezoli J, Misery P, Falchier A, Quilodran R, Gariel MA, Sallet J, Gamanut R, Huissoud C, Clavagnier S, Giroud P, Sappey-Marinier D, Barone P, Dehay C, Toroczkai Z, Knoblauch K, Van Essen DC, Kennedy H. Markov NT, et al. Cereb Cortex. 2014 Jan;24(1):17-36. doi: 10.1093/cercor/bhs270. Epub 2012 Sep 25. Cereb Cortex. 2014. PMID: 23010748 Free PMC article. - Neurofilament protein is differentially distributed in subpopulations of corticocortical projection neurons in the macaque monkey visual pathways.
Hof PR, Ungerleider LG, Webster MJ, Gattass R, Adams MM, Sailstad CA, Morrison JH. Hof PR, et al. J Comp Neurol. 1996 Dec 2;376(1):112-27. doi: 10.1002/(SICI)1096-9861(19961202)376:1<112::AID-CNE7>3.0.CO;2-6. J Comp Neurol. 1996. PMID: 8946287 - Distributed hierarchical processing in the primate cerebral cortex.
Felleman DJ, Van Essen DC. Felleman DJ, et al. Cereb Cortex. 1991 Jan-Feb;1(1):1-47. doi: 10.1093/cercor/1.1.1-a. Cereb Cortex. 1991. PMID: 1822724 Review. - Cortical chemoarchitecture shapes macroscale effective functional connectivity patterns in macaque cerebral cortex.
Turk E, Scholtens LH, van den Heuvel MP. Turk E, et al. Hum Brain Mapp. 2016 May;37(5):1856-65. doi: 10.1002/hbm.23141. Epub 2016 Mar 11. Hum Brain Mapp. 2016. PMID: 26970255 Free PMC article. Review.
Cited by
- Cortical development in the structural model and free energy minimization.
Wright J, Bourke P. Wright J, et al. Cereb Cortex. 2024 Oct 3;34(10):bhae416. doi: 10.1093/cercor/bhae416. Cereb Cortex. 2024. PMID: 39470397 Free PMC article. - Multi-scale spiking network model of human cerebral cortex.
Pronold J, van Meegen A, Shimoura RO, Vollenbröker H, Senden M, Hilgetag CC, Bakker R, van Albada SJ. Pronold J, et al. Cereb Cortex. 2024 Oct 3;34(10):bhae409. doi: 10.1093/cercor/bhae409. Cereb Cortex. 2024. PMID: 39428578 Free PMC article. - Horizontal cortical connections shape intrinsic traveling waves into feature-selective motifs that regulate perceptual sensitivity.
Davis ZW, Busch A, Steward C, Muller L, Reynolds J. Davis ZW, et al. Cell Rep. 2024 Sep 24;43(9):114707. doi: 10.1016/j.celrep.2024.114707. Epub 2024 Sep 6. Cell Rep. 2024. PMID: 39243374 Free PMC article. - Network analysis of marmoset cortical connections reveals pFC and sensory clusters.
Pailthorpe BA. Pailthorpe BA. Front Neuroanat. 2024 Jun 12;18:1403170. doi: 10.3389/fnana.2024.1403170. eCollection 2024. Front Neuroanat. 2024. PMID: 38933918 Free PMC article. - Watercolor spreading in Bridget Riley's and Piet Mondrian's op-art placed in the context of recent watercolor studies.
Spillmann L. Spillmann L. J Vis. 2024 Jun 3;24(6):15. doi: 10.1167/jov.24.6.15. J Vis. 2024. PMID: 38913017 Free PMC article. Review.
References
- Akaike H. Information theory and an extension of the maximum likelihood principle. In: Petrov BN, Csaki F, editors. Second International Symposium on information theory. Budapest (Hungary): Akademiai Kiado; 1993. pp. 267–281.
- Amaral DG, Insausti R, Cowan WM. The entorhinal cortex of the monkey: I. Cytoarchitectonic organization. J Comp Neurol. 1987;264:326–355. - PubMed
- Andersen RA, Asanuma C, Essick G, Siegel RM. Corticocortical connections of anatomically and physiologically defined subdivisions within the inferior parietal lobule. J Comp Neurol. 1990;296:65–113. - PubMed
- Anderson JC, Martin KA. Connection from cortical area V2 to MT in macaque monkey. J Comp Neurol. 2002;443:56–70. - PubMed
Publication types
MeSH terms
Substances
LinkOut - more resources
Full Text Sources
Miscellaneous
