Cardiac and skeletal muscle defects in a mouse model of human Barth syndrome - PubMed (original) (raw)
Cardiac and skeletal muscle defects in a mouse model of human Barth syndrome
Devrim Acehan et al. J Biol Chem. 2011.
Abstract
Barth syndrome is an X-linked genetic disorder caused by mutations in the tafazzin (taz) gene and characterized by dilated cardiomyopathy, exercise intolerance, chronic fatigue, delayed growth, and neutropenia. Tafazzin is a mitochondrial transacylase required for cardiolipin remodeling. Although tafazzin function has been studied in non-mammalian model organisms, mammalian genetic loss of function approaches have not been used. We examined the consequences of tafazzin knockdown on sarcomeric mitochondria and cardiac function in mice. Tafazzin knockdown resulted in a dramatic decrease of tetralinoleoyl cardiolipin in cardiac and skeletal muscles and accumulation of monolysocardiolipins and cardiolipin molecular species with aberrant acyl groups. Electron microscopy revealed pathological changes in mitochondria, myofibrils, and mitochondrion-associated membranes in skeletal and cardiac muscles. Echocardiography and magnetic resonance imaging revealed severe cardiac abnormalities, including left ventricular dilation, left ventricular mass reduction, and depression of fractional shortening and ejection fraction in tafazzin-deficient mice. Tafazzin knockdown mice provide the first mammalian model system for Barth syndrome in which the pathophysiological relationships between altered content of mitochondrial phospholipids, ultrastructural abnormalities, myocardial and mitochondrial dysfunction, and clinical outcome can be completely investigated.
Figures
FIGURE 1.
Development of ROSA26-taz shRNATet-On in mouse ES cells. A, mouse ES cells with a pre-engineered RMCE acceptor site were used for the site-directed knock-in of a tetracycline-inducible taz shRNA cassette into the ROSA26 locus. Tafazzin shRNA structure is depicted at the bottom of A. An RMCE acceptor site in the ROSA26 locus consists of the Zsgreen fluorescent protein expression unit (Zsgreen-pA), hygromycin resistance cassette (PGK-HygR), and FLPe recombinase expression module (CAGGS-FLPe). Neomycin selection and the subsequent assay for hygromycin sensitivity were applied to isolate the desired clones (ROSA RMCE exchanged). Selected clones were screened by Southern blot analysis of HindIII and BamHI restriction fragments (not shown). Correctly targeted clones (71% of all neomycin-resistant clones) produce 6.2-kb HindIII and 3.2-kb BamHI fragments on Southern blots with 5′ sense probe (SP) and 3′ sense probe DNA probes (solid black bars), respectively. B, schematic representation of tet repressor (TetR)-mediated control of shRNA expression. Transcription of shRNA is blocked by TetR. Upon induction by dox, TetR is removed from the tet operator sequences (TetO) that is inserted into the promoter, allowing transcription of shRNA. SA, splicing acceptor signal. The technology used in the study to make this tafazzin knockdown mouse is the proprietary property of TaconicArtemis GmbH.
FIGURE 2.
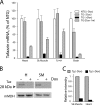
Dox-inducible shRNA-mediated tafazzin knockdown. A, quantitative RT-PCR analysis of taz mRNA levels in heart, skeletal (Sk) muscle (EDL), liver, and brain of 2-month-old NTG control males, non-induced taz shRNA TG males, dox-induced taz shRNA TG males, and taz shRNA TG males induced only for the first 4 weeks and then withdrawn from the dox-containing diet. Tafazzin mRNA abundance as a percentage of NTG controls is plotted. Data are expressed as the means ± S.E. from three or more experiments. B, representative Western blot of tafazzin protein in mitochondrial extracts of skeletal muscle (SM) and heart (H) probed with anti-tafazzin polyclonal antibodies. Anti-mitochondrial malate dehydrogenase (mMDH) antibodies were used to control for protein loading. Uncropped image of blot is shown in
supplementary Fig. 1
. C, densitometric analysis of Western blot showing an 86 and 97% reduction of tafazzin protein in skeletal and cardiac muscle-derived mitochondria, respectively.
FIGURE 3.
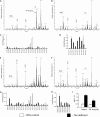
Cardiolipin and monolysocardiolipin analyses in heart and skeletal muscles of NTG control and _taz_-deficient mice. Representative MS profiles of phospholipids from heart tissue of NTG (A) and _taz_-deficient (B) mice are shown. C and D, acyl group profiles of CL (C) and MLCL (D) from hearts of NTG and _taz_-deficient mice (n = 4 for each group). E and F, representative MS profiles of phospholipids from skeletal muscle of NTG (E) and _taz_-deficient (F) mice. G and H, acyl group profiles of CL (G) and MLCL (H) from skeletal (Sk.) muscle of NTG and _taz_-deficient mice. I, MLCL/CL ratios for heart and skeletal muscle from NTG and _taz_-deficient mice (n = 4 for each group). Data are expressed as the means ± S.E. isCL and isPG denote internal standards of cardiolipin and phosphatidylglycerol (0.4 nmol), respectively.
FIGURE 4.
Defects of cardiac mitochondria and mitochondrion-associated membranes in _taz_-deficient mice. A and B, representative electron micrographs of longitudinal sections of cardiac ventricular muscle of 8-month-old NTG (A) and _taz_-deficient (B) mice. C and D, representative micrographs of deteriorating mitochondria in ventricular (C) and atrial (D) muscle from _taz_-deficient hearts. White arrows in C and K point to mitochondria undergoing mitophagy. Mitochondria with large central vacuoles are abundantly observed in _taz_-deficient cardiomyocytes (black arrowhead in D). MAMs, denoted by white arrowheads in panels E–J, are greatly affected in taz_-deficient hearts. E and G show representative cross-sections of cardiac muscle of 2-month-old (E) and 8-month-old (G) control mice, respectively. In 2-month-old taz_-deficient mice, MAMs appear slightly enlarged (F); however, in older mice, differences in MAM size and morphology become more pronounced (H–J). Scale bars, 500 nm. In all panels, mitochondria are marked with letter “_M,” and sarcomeres are marked with the letter “_S.”
FIGURE 5.
Mitochondrial defects in skeletal muscle of _taz_-deficient mice. Representative cross-sectional micrographs of EDL (A–C, E, and G–I) and soleus muscles (F) are shown. A, cross-section of EDL from a 2-month-old NTG mouse. Honeycomb-like formations, denoted by white arrowheads, are abundantly present in EDL of 2-month-old (B–E) and 8-month-old (I) _taz_-deficient mice. F, aggregated mitochondria in the soleus muscle of a 2-month-old taz_-deficient mouse. G, H, and I are representative micrographs of mitophagy (black arrowheads) in EDL muscle of 2-month-old (G) and 8-month-old (I) taz_-deficient mice. H shows a grossly abnormal mitochondrion (black arrowhead) surrounded by an autophagic vacuole filled with ubiquitinated material (ub). Scale bars, 500 nm. In all panels, mitochondria are marked with the letter “_M,” and sarcomeres are marked with the letter “_S.”
FIGURE 6.
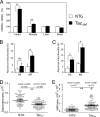
Mitochondrial proliferation and altered ultrastructure in _taz_-deficient mice. A compares mtDNA content with nuclear DNA (nDNA) content in various tissues of NTG and _taz_-deficient mice as a measure of mitochondrial abundance. mtDNA to nuclear DNA ratios as a percentage of NTG controls with S.E. are plotted. B and C, morphometric analyses of mitochondria in cardiac (B) and skeletal (C) muscles. The proportions of cardiac and skeletal muscle mitochondria displaying various structural abnormalities (Figs. 3 and 4) are plotted. Data are means with S.E. of three experiments in each of which we evaluated four or more mitochondrial cross-sections per group. D and E, quantitative morphometric analyses of sarcomere (D) and MAM (E) areas in the cross-sectional micrographs from heart of 8-month-old mice. Numbers are means ± S.E., and the numbers of experimental points are in parentheses. Asterisks denote significant differences between groups (NS, non-significant; *, p < 0.05; **, p < 0.001). The differences in means in D and E were assessed by non-parametric Mann-Whitney U test.
FIGURE 7.
Impaired cardiac function in 8-month-old _taz_-deficient (Tazdef) mice. A, representative M-mode echocardiographic tracings of NTG and _taz_-deficient mice. Diastolic dimension is indicated by solid lines, and systolic dimension is indicated by dotted lines. Chamber dilation and thinning of the ventricular walls are evident in the _taz_-deficient mouse. B, representative short axis cardiac MRI of NTG and _taz_-deficient mice at end diastole (ED) and end systole (ES).
Similar articles
- Tafazzin deficiency impairs CoA-dependent oxidative metabolism in cardiac mitochondria.
Le CH, Benage LG, Specht KS, Li Puma LC, Mulligan CM, Heuberger AL, Prenni JE, Claypool SM, Chatfield KC, Sparagna GC, Chicco AJ. Le CH, et al. J Biol Chem. 2020 Aug 28;295(35):12485-12497. doi: 10.1074/jbc.RA119.011229. Epub 2020 Jul 14. J Biol Chem. 2020. PMID: 32665401 Free PMC article. - A murine model of Barth syndrome recapitulates human cardiac and skeletal muscle phenotypes.
Yazawa E, Keating EM, Wang S, Sweat ME, Ma Q, Xu Y, Schlame M, Pu WT. Yazawa E, et al. Dis Model Mech. 2025 May 1;18(5):dmm052077. doi: 10.1242/dmm.052077. Epub 2025 May 19. Dis Model Mech. 2025. PMID: 40326536 Free PMC article. - Characterization of a transgenic short hairpin RNA-induced murine model of Tafazzin deficiency.
Soustek MS, Falk DJ, Mah CS, Toth MJ, Schlame M, Lewin AS, Byrne BJ. Soustek MS, et al. Hum Gene Ther. 2011 Jul;22(7):865-71. doi: 10.1089/hum.2010.199. Epub 2011 May 19. Hum Gene Ther. 2011. PMID: 21091282 Free PMC article. - Barth Syndrome: Connecting Cardiolipin to Cardiomyopathy.
Ikon N, Ryan RO. Ikon N, et al. Lipids. 2017 Feb;52(2):99-108. doi: 10.1007/s11745-016-4229-7. Epub 2017 Jan 9. Lipids. 2017. PMID: 28070695 Free PMC article. Review. - Barth syndrome: cardiolipin, cellular pathophysiology, management, and novel therapeutic targets.
Zegallai HM, Hatch GM. Zegallai HM, et al. Mol Cell Biochem. 2021 Mar;476(3):1605-1629. doi: 10.1007/s11010-020-04021-0. Epub 2021 Jan 7. Mol Cell Biochem. 2021. PMID: 33415565 Review.
Cited by
- Dysfunctional cardiac mitochondrial bioenergetic, lipidomic, and signaling in a murine model of Barth syndrome.
Kiebish MA, Yang K, Liu X, Mancuso DJ, Guan S, Zhao Z, Sims HF, Cerqua R, Cade WT, Han X, Gross RW. Kiebish MA, et al. J Lipid Res. 2013 May;54(5):1312-25. doi: 10.1194/jlr.M034728. Epub 2013 Feb 14. J Lipid Res. 2013. PMID: 23410936 Free PMC article. - Determining the Likelihood of Disease Pathogenicity Among Incidentally Identified Genetic Variants in Rare Dilated Cardiomyopathy-Associated Genes.
Yang Q, Berkman AM, Ezekian JE, Rosamilia M, Rosenfeld JA, Liu P, Landstrom AP. Yang Q, et al. J Am Heart Assoc. 2022 Oct 4;11(19):e025257. doi: 10.1161/JAHA.122.025257. Epub 2022 Sep 21. J Am Heart Assoc. 2022. PMID: 36129056 Free PMC article. - Disorders of phospholipid metabolism: an emerging class of mitochondrial disease due to defects in nuclear genes.
Lu YW, Claypool SM. Lu YW, et al. Front Genet. 2015 Feb 3;6:3. doi: 10.3389/fgene.2015.00003. eCollection 2015. Front Genet. 2015. PMID: 25691889 Free PMC article. Review. - Cardiolipin Remodeling Defects Impair Mitochondrial Architecture and Function in a Murine Model of Barth Syndrome Cardiomyopathy.
Zhu S, Chen Z, Zhu M, Shen Y, Leon LJ, Chi L, Spinozzi S, Tan C, Gu Y, Nguyen A, Zhou Y, Feng W, Vaz FM, Wang X, Gustafsson AB, Evans SM, Kunfu O, Fang X. Zhu S, et al. Circ Heart Fail. 2021 Jun;14(6):e008289. doi: 10.1161/CIRCHEARTFAILURE.121.008289. Epub 2021 Jun 15. Circ Heart Fail. 2021. PMID: 34129362 Free PMC article. - Impaired Cardiolipin Biosynthesis Prevents Hepatic Steatosis and Diet-Induced Obesity.
Cole LK, Mejia EM, Vandel M, Sparagna GC, Claypool SM, Dyck-Chan L, Klein J, Hatch GM. Cole LK, et al. Diabetes. 2016 Nov;65(11):3289-3300. doi: 10.2337/db16-0114. Epub 2016 Aug 5. Diabetes. 2016. PMID: 27495222 Free PMC article.
References
- Schlame M., Ren M., Xu Y., Greenberg M. L., Haller I. (2005) Chem. Phys. Lipids 138, 38–49 - PubMed
- Gu Z., Valianpour F., Chen S., Vaz F. M., Hakkaart G. A., Wanders R. J., Greenberg M. L. (2004) Mol. Microbiol. 51, 149–158 - PubMed
Publication types
MeSH terms
Substances
LinkOut - more resources
Full Text Sources
Other Literature Sources
Molecular Biology Databases


