Reverse-phase phosphoproteome analysis of signaling pathways induced by Rift valley fever virus in human small airway epithelial cells - PubMed (original) (raw)
Reverse-phase phosphoproteome analysis of signaling pathways induced by Rift valley fever virus in human small airway epithelial cells
Taissia G Popova et al. PLoS One. 2010.
Abstract
Rift valley fever virus (RVFV) infection is an emerging zoonotic disease endemic in many countries of sub-Saharan Africa and in Egypt. In this study we show that human small airway epithelial cells are highly susceptible to RVFV virulent strain ZH-501 and the attenuated strain MP-12. We used the reverse-phase protein arrays technology to identify phosphoprotein signaling pathways modulated during infection of cultured airway epithelium. ZH-501 infection induced activation of MAP kinases (p38, JNK and ERK) and downstream transcriptional factors [STAT1 (Y701), ATF2 (T69/71), MSK1 (S360) and CREB (S133)]. NF-κB phosphorylation was also increased. Activation of p53 (S15, S46) correlated with the increased levels of cleaved effector caspase-3, -6 and -7, indicating activation of the extrinsic apoptotic pathway. RVFV infection downregulated phosphorylation of a major anti-apoptotic regulator of survival pathways, AKT (S473), along with phosphorylation of FOX 01/03 (T24/31) which controls cell cycle arrest downstream from AKT. Consistent with this, the level of apoptosis inhibitor XIAP was decreased. However, the intrinsic apoptotic pathway marker, caspase-9, demonstrated only a marginal activation accompanied by an increased level of the inhibitor of apoptosome formation, HSP27. Concentration of the autophagy marker, LC3B, which often accompanies the pro-survival signaling, was decreased. Cumulatively, our analysis of RVFV infection in lung epithelium indicated a viral strategy directed toward the control of cell apoptosis through a number of transcriptional factors. Analyses of MP-12 titers in challenged cells in the presence of MAPK inhibitors indicated that activation of p38 represents a protective cell response while ERK activation controls viral replication.
Conflict of interest statement
Competing Interests: The authors have declared that no competing interests exist.
Figures
Figure 1. Quantitative analysis of the newly-formed virus released from HSAECs into culture supernatants.
A. Plaque assay data are presented as lg (PFU/ml) in supernatants of RVFV-infected HSAECs for MOI of 0.002. B, C. Western blot of lysed cells using antibodies against peptide from the middle of RVFV M segment and against actin (B, for MOI of 0.002 and C, for MOI of 0.0002). The amount of cells loaded was 1.4×10⁴ cells per well. Band intensities (arbitrary units) of viral proteins above the background detected in uninfected cells are shown as graphs below of Western data. The positions of Gc, Gn and NSm proteins translated from the M-segment are shown with arrows.
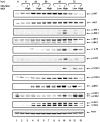
Figure 2. Example of RPMA slides stained with antibodies against total and phosphorylated forms of SAP/JNK, ERK and AKT and against phosphorylated form of p-38 and PTEN.
Portions of slides stained with antibodies against total and phosphorylated protein forms are shown for untreated (Control) and RVFV-infected HSAECs at 48 and 72 h.p.i. Low and high MOI correspond to 0.0002 and 0.002, respectively. Each sample along with eight 2× serial dilutions was printed in duplicate. Prefixes t and p indicate the total and phosphorylated proteins, correspondingly.
Figure 3. Total level of cellular proteins in RVFV-infected HSAECs.
Slides stained with Sypro Ruby and normalized relative to uninfected HSAECs at 0 h.p.i. Each sample of 40 cells per dot along with seven 2× serial dilutions was printed in duplicate. Black and gray bars illustrate the MOI of 0.002 and 0.0002, correspondingly. Data represent mean values and confidence intervals of two-tail t-test (α = 0.05, n = 3).
Figure 4. Confirmation of RPMA data by Western blot using antibodies against phosphorylated and total forms of several proteins.
Western blots were performed on two independent experiments. The RVFV-infected HSAECs with MOI of 0.002 and 0.0002 at corresponding time points are indicated with a + sign. Samples 1, 2, 4, 6, 8 and 11 are from untreated cells at 0, 5, 24, 30, 48 and 72 h.p.i. and samples 3, 5, 7, 10 and 13 are RVFV-infected HSAECs with MOI of 0.002 at 5, 24, 30, 48 and 72 h.p.i. Samples 9 and 12 correspond to the cells infected with MOI of 0.0002 at 48 and 72 h.p.i.
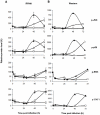
Figure 5. Comparison of RPMA and Western blot data.
Left panels (A) show the RPMA data. Right panels (B) show Western blot confirmatory data. X axis labels, time post infection (h.p.i.); Y axis labels, protein level relative to untreated cells (%) at 0 h.p.i. Open triangles, closed triangles and open squares correspond to the low MOI, high MOI and uninfected cells, respectively. RPMA data represent mean values and confidence intervals of two-tail t-test (α = 0.05, n = 3). Western blot data represent average of two independent experiments.
Figure 6. RPMA data for caspase-3, -6, -7, and -9 and actin.
X axis labels, time post infection (h.p.i); Y axis labels, protein level relative to untreated cells (%) at 0 h.p.i. Open triangles, closed triangles and open squares correspond to the low MOI, high MOI and uninfected cells, respectively. Data represent mean values and confidence intervals of two-tail t-test (α = 0.05, n = 3).
Figure 7. Effect of inhibitors on RVFV replication.
HSAECS were plated at 5×10⁴ cells per well in a 96-well plate and pretreated with either DMSO or indicated inhibitors for 5 h prior to RVFV infection at MOI of 0.002 as described in Materials and Methods. Following infection, fresh medium containing inhibitors was added. Supernatants were collected at 48 h.p.i., viral RNA extracted and analyzed by q-RT-PCR. * p = 0.0002, ** p = 0.031 (t-test) relative to mock control.
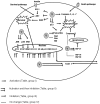
Figure 8. RPMA data presented as a diagram of signaling events in HSAECs infected with RVFV.
Among the most prominent responses was activation of MAP kinases (p38, JNK and ERK) and the downstream transcriptional factors [STAT1 (Y701), ATF2 (T69–71), MSK1 (S360), and CREB (S133)]. STAT3 and NF-κB phosphorylation were also increased. Activation of p53(S15, S46), which typically accompanies transcriptional upregulation of the apoptotic genes correlated with the increased levels of cleaved effector caspase-3, -6 and -7 indicating activation of the extrinsic apoptotic pathway. RVFV infection also downregulated phosphorylation of a major anti-apoptotic regulator of survival pathways, AKT (S473). Consistent with this, the level of apoptosis inhibitor XIAP100 was decreased. The intrinsic apoptotic pathway marker, caspase-9, demonstrated only a marginal activation accompanied by increased level of the inhibitor of apoptosome formation, HSP27.
Similar articles
- Induction of DNA damage signaling upon Rift Valley fever virus infection results in cell cycle arrest and increased viral replication.
Baer A, Austin D, Narayanan A, Popova T, Kainulainen M, Bailey C, Kashanchi F, Weber F, Kehn-Hall K. Baer A, et al. J Biol Chem. 2012 Mar 2;287(10):7399-410. doi: 10.1074/jbc.M111.296608. Epub 2012 Jan 5. J Biol Chem. 2012. PMID: 22223653 Free PMC article. - The NSs Protein Encoded by the Virulent Strain of Rift Valley Fever Virus Targets the Expression of Abl2 and the Actin Cytoskeleton of the Host, Affecting Cell Mobility, Cell Shape, and Cell-Cell Adhesion.
Bamia A, Marcato V, Boissière M, Mansuroglu Z, Tamietti C, Romani M, Simon D, Tian G, Niedergang F, Panthier JJ, Flamand M, Souès S, Bonnefoy E. Bamia A, et al. J Virol. 2020 Dec 9;95(1):e01768-20. doi: 10.1128/JVI.01768-20. Print 2020 Dec 9. J Virol. 2020. PMID: 33087469 Free PMC article. - A Genome-Wide RNA Interference Screen Identifies a Role for Wnt/β-Catenin Signaling during Rift Valley Fever Virus Infection.
Harmon B, Bird SW, Schudel BR, Hatch AV, Rasley A, Negrete OA. Harmon B, et al. J Virol. 2016 Jul 27;90(16):7084-7097. doi: 10.1128/JVI.00543-16. Print 2016 Aug 15. J Virol. 2016. PMID: 27226375 Free PMC article. - Single-cycle replicable Rift Valley fever virus mutants as safe vaccine candidates.
Terasaki K, Tercero BR, Makino S. Terasaki K, et al. Virus Res. 2016 May 2;216:55-65. doi: 10.1016/j.virusres.2015.05.012. Epub 2015 May 27. Virus Res. 2016. PMID: 26022573 Free PMC article. Review. - Molecular aspects of Rift Valley fever virus and the emergence of reassortants.
Gaudreault NN, Indran SV, Balaraman V, Wilson WC, Richt JA. Gaudreault NN, et al. Virus Genes. 2019 Feb;55(1):1-11. doi: 10.1007/s11262-018-1611-y. Epub 2018 Nov 13. Virus Genes. 2019. PMID: 30426314 Review.
Cited by
- Curcumin inhibits Rift Valley fever virus replication in human cells.
Narayanan A, Kehn-Hall K, Senina S, Lundberg L, Van Duyne R, Guendel I, Das R, Baer A, Bethel L, Turell M, Hartman AL, Das B, Bailey C, Kashanchi F. Narayanan A, et al. J Biol Chem. 2012 Sep 28;287(40):33198-214. doi: 10.1074/jbc.M112.356535. Epub 2012 Jul 30. J Biol Chem. 2012. PMID: 22847000 Free PMC article. - Newcastle disease virus induces clathrin-mediated endocytosis to establish infection through the activation of PI3K/AKT signaling pathway by VEGFR2.
Fan L, Xiao H, Ren J, Hou Y, Cai J, Wu W, Xiang B, Lin Q, Liao M, Ren T, Chen L. Fan L, et al. J Virol. 2024 Oct 22;98(10):e0132224. doi: 10.1128/jvi.01322-24. Epub 2024 Sep 10. J Virol. 2024. PMID: 39254313 - HijAkt: The PI3K/Akt pathway in virus replication and pathogenesis.
Dunn EF, Connor JH. Dunn EF, et al. Prog Mol Biol Transl Sci. 2012;106:223-50. doi: 10.1016/B978-0-12-396456-4.00002-X. Prog Mol Biol Transl Sci. 2012. PMID: 22340720 Free PMC article. Review. - Induction of DNA damage signaling upon Rift Valley fever virus infection results in cell cycle arrest and increased viral replication.
Baer A, Austin D, Narayanan A, Popova T, Kainulainen M, Bailey C, Kashanchi F, Weber F, Kehn-Hall K. Baer A, et al. J Biol Chem. 2012 Mar 2;287(10):7399-410. doi: 10.1074/jbc.M111.296608. Epub 2012 Jan 5. J Biol Chem. 2012. PMID: 22223653 Free PMC article. - Large-scale chromatin immunoprecipitation with promoter sequence microarray analysis of the interaction of the NSs protein of Rift Valley fever virus with regulatory DNA regions of the host genome.
Benferhat R, Josse T, Albaud B, Gentien D, Mansuroglu Z, Marcato V, Souès S, Le Bonniec B, Bouloy M, Bonnefoy E. Benferhat R, et al. J Virol. 2012 Oct;86(20):11333-44. doi: 10.1128/JVI.01549-12. Epub 2012 Aug 15. J Virol. 2012. PMID: 22896612 Free PMC article.
References
- Balkhy HH, Memish ZA. Rift Valley fever: an uninvited zoonosis in the Arabian peninsula. Int J Antimicrob Agents. 2003;21:153–157. - PubMed
- Peters CJ, Meegan JM. Rift Valley fever. Boca Raton, FL: CRC Press; 1989.
- Gerdes GH. Rift valley fever. Vet Clin N Am Food Anim Pract. 2002;18:549–555. - PubMed
- Flick R, Bouloy M. Rift Valley virus. Curr Mol Med. 2005;5:827–834. - PubMed
Publication types
MeSH terms
Substances
LinkOut - more resources
Full Text Sources
Molecular Biology Databases
Research Materials
Miscellaneous


