Functional organization for color and orientation in macaque V4 - PubMed (original) (raw)
Comparative Study
. 2010 Dec;13(12):1542-8.
doi: 10.1038/nn.2676. Epub 2010 Nov 14.
Affiliations
- PMID: 21076422
- PMCID: PMC3005205
- DOI: 10.1038/nn.2676
Comparative Study
Functional organization for color and orientation in macaque V4
Hisashi Tanigawa et al. Nat Neurosci. 2010 Dec.
Abstract
Visual area V4 in the macaque monkey is a cortical area that is strongly involved in color and shape perception. However, fundamental questions about V4 are still debated. V4 was initially characterized as a color-processing area, but subsequent studies revealed that it contains a diverse complement of cells, including those with preference for color, orientation, disparity and higher-order feature preferences. This has led to disputes and uncertainty about the role of V4 in vision. Using intrinsic signal optical imaging methods in awake, behaving monkeys, we found that different feature preferences are functionally organized in V4. Optical images revealed that regions with preferential response to color were largely separate from orientation-selective regions. Our results help to resolve long-standing controversies regarding functional diversity and retinotopy in V4 and indicate the presence of spatially biased distribution of featural representation in V4 in the ventral visual pathway.
Figures
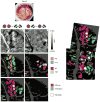
Figure 1. Examples of time course of stimulus-evoked reflectance change in V4
(a) Sampled sites indicated by black crosses on an image of exposed V4 cortical surface taken under 570 nm illumination. Scale bar, 1 mm. (b-f) Time courses of average reflectance change (Δ_R/R_) under 632 nm illumination at the sampled sites (160 μm in diameter) in response to a stimulus patch containing one of four gratings (red: 45° RG, orange: 135° RG, blue: 45° Lum, blue: 135° Lum; see Methods for details). The response values were taken from the single condition map, in which high-pass filtering and blank subtraction were applied. Error bars represent SEM.
Figure 2. Functional maps of color/luminance and orientation sensitivity in foveal V4
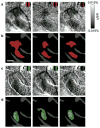
(a,b) Views of the cortical surface including dorsal V4 through the imaging chamber. The white rectangles indicate the imaged regions (a, case 1; b, case 3). (c–f) Difference maps in response to isoluminant red/green gratings versus luminance-contrast achromatic gratings (c,e, RG – Lum) and gratings tilted counterclockwise 45° versus 135° from the horizontal (d,f, 45° – 135°). In these maps, dark versus light pixels represent greater response to RG versus Lum (c,e) and 45° versus 135° (d,f). Gratings above the maps indicate the subtraction pair for each difference map. (g–j) Statistical maps show significant differences in response to RG versus Lum (g,i) and 45° versus 135° (h,j) (two-tailed _t_-test, n = 414 trials for case 1 and 236 trials for case 3). Colored areas indicate significantly larger response to one of paired conditions, according to the key shown at the right. (k–n) Statistical maps revealed byusing two-way ANOVAs show regions with a significant main effect of stimulus color type (RG/Lum) (k,m, magenta), with a significant main effect of stimulus orientation (k,m, green), and with a significant interaction (l,n, white). In g–n, the brightness of color indicates the significance level, P < 0.05 (dark) and P < 0.0001 (bright), uncorrected, and dark gray regions indicate pixels with large cross-trial variability (see Methods). The sampled sites in Figure 1 are shown by black crosses in k. lu, lunate sulcus; st, superior temporal sulcus; io, inferior occipital sulcus; A, anterior; D, dorsal. Scale bar, 1 mm in c–n.
Figure 3. Functional maps of color/luminance and orientation sensitivity in parafoveal V4
(a–g) Data from a parafoveal V4 (~ 5° eccentricity) of the same animal as case 1 (case 2; n = 400 trials). Conventions are as for Figure 2. (h) Overlay of the maps of RG/Lum-sensitive (magenta) and orientation-sensitive (green) regions in the foveal (Fig. 2k) and parafoveal V4 (f), aligned using the surface blood vessel pattern. Note also, magenta and green regions in V2, consistent with thin and thick/pale stripe organization, respectively,. Scale bar, 1 mm.
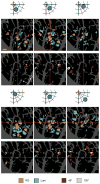
Figure 4. Overall spatial pattern of modulation by the stimulus at different locations in the visual field
(a–f) Response to shifting the polar angle. Regions with a significant difference in response to RG versus Lum (a–c, case 3) and to 45° versus 135° (d–f), presented at a different polar angle with the same eccentricity as illustrated above (two-tailed _t_-test, n = 161 for a,d, 159 for b,e, and 151 trials for c,f). The center of stimuli was located at polar angles of 22.5° for a,d, 45° for b,e, and 67.5° for c,f from the vertical meridian and an eccentricity of 1.5°. As the stimulus location moved away from the vertical meridian along a line of isoeccentricity, the overall activation shifted from posterior to anterior (use vertical red lines as guide). (g–l) Response to shifting the eccentricity. Regions with a significant difference in response to RG versus Lum (g–i) and to 45° versus 135° (j–l), presented at a different eccentricity along an isopolar axis as illustrated above (two-tailed _t_-test, n = 164 for g,j, 159 for h,k, and 159 trials for i,l). The center of stimuli was located at a polar angle of 45° from the vertical meridian and at eccentricities of 0.5° for g,j, 1.5° for h,k, and 2.5° for i,l. As the stimulus location moved towards larger eccentricities, the overall activation shifted from ventral to dorsal (use horizontal red lines as guide). The size of grating patches was 1° in diameter. Scale bar, 1 mm.
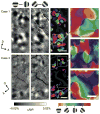
Figure 5. Functional maps of orientation preference in V4
(a,b) Difference maps to orthogonally oriented gratings (a, 0° −90°; b, 45° −135°; case 1). Dark versus light pixels represent greater response to 0° versus 90° (a) and 45° versus 135° (b). (c) Color-coded polar map of orientation preference (orientation preference indicated by hue and magnitude of orientation selectivity by brightness. Pure black regions represent pixels without significant selectivity for orientation (ANOVA, 4 orientations, P > 0.05, uncorrected, n = 690 trials). (d–f) Data from another animal (case 3; n = 468 trials). Conventions are as for a–c. (g–i) Angle maps of regions in white frames in c and f (frame 1, g; frame 2, h; frame 3, i). In these maps, all hues are saturated in brightness to indicate only orientation preference. Scale bar, 1 mm in a–f and 0.5 mm in g–i.
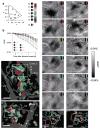
Figure 6. Functional map of hue preference in V4
(a) Left: stimulus colors plotted on the CIE 1931-xy chromaticity diagram (dots). M, magenta; R, red; Y, yellow; G, green; C, cyan; B, blue; W, white. Right: the key for the hue-preference map. (b) Time courses of reflectance change at a sampled site (white dot in c) in response to each of six types of colored gratings and one type of achromatic gratings. Error bars represent SEM. Other conventions are as in Fig. 1b. (c,d) Large field views of color-coded polar maps of hue preference (c, case 2; d, case 3). Pixels with no significant selectivity for hue (one-way ANOVA, 6 hues, P > 0.05, uncorrected, n = 707 trials for c, n = 495 trials for d) and pixels with large cross-trial variability are shaded in black and dark gray, respectively. (e,f) Difference maps taken from the boxed region in c and d, respectively. These maps were calculated by subtracting the response to achromatic gratings from the response to each of 6 colored gratings (top to the second from the bottom). The regions with a significantly larger response to one of colored gratings than to achromatic gratings are outlined by that color in the bottom panels (two-tailed _t_-test, P < 0.05 and peak P < 0.0001, uncorrected, n = 231, 230, 227, 229, 231, and 225 trials in e, n = 165, 170, 167, 162, 165, and 164 trials in f, from magenta to blue, respectively). Scale bar, 1.0 mm in c,d and 0.5 mm in e,f.
Figure 7. Luminance invariance in responses of hue-preferring region
(a–c) Difference maps of red/black gratings minus achromatic gratings (Lum) obtained from a color-responsive region of parafoveal V4 (case 4) with different luminance. The luminance of red strips in gratings used was 23.1 cd/m2 in a, 15.4 cd/m2 (33.3% darker) in b, 7.69 cd/m2 (66.7% darker) in c. The luminance of white strips in Lum and background was 23.1 cd/m2 and 11.6 cd/m2, respectively. (d–f) Statistical maps show regions with a significantly larger response to red/black gratings than to Lum in a–c (colored areas, two-tailed _t_-test, n = 137, 137, and 138 trials for d–f, respectively). (g–i) Difference maps of green/black gratings minus Lum obtained from the same region as in a–c. The luminance profiles of gratings were the same as in a–c, respectively. (j–l) Statistical maps show regions with a significantly larger response to green/black gratings than to Lum in g–i (two-tailed _t_-test, n = 105, 103, and 104 trials for j–l, respectively). Scale bar, 0.5 mm.
Similar articles
- Hue and orientation pinwheels in macaque area V4.
Parajuli A, Felleman DJ. Parajuli A, et al. J Neurophysiol. 2024 Aug 1;132(2):589-615. doi: 10.1152/jn.00366.2023. Epub 2024 Jul 11. J Neurophysiol. 2024. PMID: 38988289 - An Orientation Map for Disparity-Defined Edges in Area V4.
Fang Y, Chen M, Xu H, Li P, Han C, Hu J, Zhu S, Ma H, Lu HD. Fang Y, et al. Cereb Cortex. 2019 Feb 1;29(2):666-679. doi: 10.1093/cercor/bhx348. Cereb Cortex. 2019. PMID: 29329408 - A motion direction preference map in monkey V4.
Li P, Zhu S, Chen M, Han C, Xu H, Hu J, Fang Y, Lu HD. Li P, et al. Neuron. 2013 Apr 24;78(2):376-88. doi: 10.1016/j.neuron.2013.02.024. Neuron. 2013. PMID: 23622068 - Visual Functions of Primate Area V4.
Pasupathy A, Popovkina DV, Kim T. Pasupathy A, et al. Annu Rev Vis Sci. 2020 Sep 15;6:363-385. doi: 10.1146/annurev-vision-030320-041306. Epub 2020 Jun 24. Annu Rev Vis Sci. 2020. PMID: 32580663 Free PMC article. Review. - Toward a unified theory of visual area V4.
Roe AW, Chelazzi L, Connor CE, Conway BR, Fujita I, Gallant JL, Lu H, Vanduffel W. Roe AW, et al. Neuron. 2012 Apr 12;74(1):12-29. doi: 10.1016/j.neuron.2012.03.011. Neuron. 2012. PMID: 22500626 Free PMC article. Review.
Cited by
- Columnar specificity of microvascular oxygenation and blood flow response in primary visual cortex: evaluation by local field potential and spiking activity.
Wang Z, Roe AW. Wang Z, et al. J Cereb Blood Flow Metab. 2012 Jan;32(1):6-16. doi: 10.1038/jcbfm.2011.152. Epub 2011 Oct 26. J Cereb Blood Flow Metab. 2012. PMID: 22027939 Free PMC article. - Human V4 Activity Patterns Predict Behavioral Performance in Imagery of Object Color.
Bannert MM, Bartels A. Bannert MM, et al. J Neurosci. 2018 Apr 11;38(15):3657-3668. doi: 10.1523/JNEUROSCI.2307-17.2018. Epub 2018 Mar 8. J Neurosci. 2018. PMID: 29519852 Free PMC article. - Inverted optical intrinsic response accompanied by decreased cerebral blood flow are related to both neuronal inhibition and excitation.
Ma Z, Cao P, Sun P, Zhao L, Li L, Tong S, Lu Y, Yan Y, Chen Y, Chai X. Ma Z, et al. Sci Rep. 2016 Feb 10;6:21627. doi: 10.1038/srep21627. Sci Rep. 2016. PMID: 26860040 Free PMC article. - Curvature domains in V4 of macaque monkey.
Hu JM, Song XM, Wang Q, Roe AW. Hu JM, et al. Elife. 2020 Nov 19;9:e57261. doi: 10.7554/eLife.57261. Elife. 2020. PMID: 33211004 Free PMC article. - Spatial and temporal scales of neuronal correlation in visual area V4.
Smith MA, Sommer MA. Smith MA, et al. J Neurosci. 2013 Mar 20;33(12):5422-32. doi: 10.1523/JNEUROSCI.4782-12.2013. J Neurosci. 2013. PMID: 23516307 Free PMC article.
References
- Levitt JB, Kiper DC, Movshon JA. Receptive field and functional architecture of macaque V2. J Neurophysiol. 1994;71:2517–2542. - PubMed
- Sincich LC, Horton JC. The circuitry of V1 and V2: integration of color, form, and motion. Annu Rev Neurosci. 2005;28:303–326. - PubMed
Publication types
MeSH terms
LinkOut - more resources
Full Text Sources


