Proteomics and transcriptomics characterization of bile stress response in probiotic Lactobacillus rhamnosus GG - PubMed (original) (raw)
. 2011 Feb;10(2):M110.002741.
doi: 10.1074/mcp.M110.002741. Epub 2010 Nov 15.
Kati Laakso, Johanna Koponen, Matti Kankainen, Dario Greco, Petri Auvinen, Kirsi Savijoki, Tuula A Nyman, Anu Surakka, Tuomas Salusjärvi, Willem M de Vos, Soile Tynkkynen, Nisse Kalkkinen, Pekka Varmanen
Affiliations
- PMID: 21078892
- PMCID: PMC3033674
- DOI: 10.1074/mcp.M110.002741
Proteomics and transcriptomics characterization of bile stress response in probiotic Lactobacillus rhamnosus GG
Kerttu Koskenniemi et al. Mol Cell Proteomics. 2011 Feb.
Abstract
Lactobacillus rhamnosus GG (GG) is a widely used and intensively studied probiotic bacterium. Although the health benefits of strain GG are well documented, the systematic exploration of mechanisms by which this strain exerts probiotic effects in the host has only recently been initiated. The ability to survive the harsh conditions of the gastrointestinal tract, including gastric juice containing bile salts, is one of the vital characteristics that enables a probiotic bacterium to transiently colonize the host. Here we used gene expression profiling at the transcriptome and proteome levels to investigate the cellular response of strain GG toward bile under defined bioreactor conditions. The analyses revealed that in response to growth of strain GG in the presence of 0.2% ox gall the transcript levels of 316 genes changed significantly (p < 0.01, t test), and 42 proteins, including both intracellular and surface-exposed proteins (i.e. surfome), were differentially abundant (p < 0.01, t test in total proteome analysis; p < 0.05, t test in surfome analysis). Protein abundance changes correlated with transcriptome level changes for 14 of these proteins. The identified proteins suggest diverse and specific changes in general stress responses as well as in cell envelope-related functions, including in pathways affecting fatty acid composition, cell surface charge, and thickness of the exopolysaccharide layer. These changes are likely to strengthen the cell envelope against bile-induced stress and signal the GG cells of gut entrance. Notably, the surfome analyses demonstrated significant reduction in the abundance of a protein catalyzing the synthesis of exopolysaccharides, whereas a protein dedicated for active removal of bile compounds from the cells was up-regulated. These findings suggest a role for these proteins in facilitating the well founded interaction of strain GG with the host mucus in the presence of sublethal doses of bile. The significance of these findings in terms of the functionality of a probiotic bacterium is discussed.
Figures
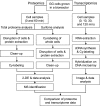
Fig. 1.
Work flow of proteome and transcriptome analyses of GG samples. 2-DE, two-dimensional gel electrophoresis.
Fig. 2.
Venn diagrams showing numbers of differentially expressed genes in response to bile stress. A, the number of differentially transcribed genes 10, 30, and 120 min after bile exposure. B, comparison of the number of differentially expressed genes at the transcriptome and proteome levels. Transcriptome results include the changes observed 10, 30, and 120 min after bile addition, and proteome results include changes in the total proteome and in the surfome 60 min after bile exposure.
Fig. 3.
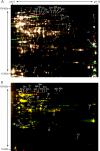
Proteome analysis of GG proteins before and after applying bile stress. A, representative overlay image of a two-dimensional DIGE gel containing proteins extracted from GG right before and 60 min after the addition of bile. The total amount of protein used for CyDye labeling was 96 μg. Protein spots appearing in red were more abundant 60 min after addition of bile, and the abundance of protein spots appearing in green was decreased after bile addition. Protein spots appearing in yellow showed no differences in abundance between the two time points. The numbered protein spots (1–21) cut from two-dimensional gels poststained with silver and identified by MS or MS/MS are listed in Table I. B, a representative overlay image of a two-dimensional DIGE gel containing protein samples of GG cells where the surface-exposed proteome was labeled with CyDyes before and 60 min after bile addition. The total amount of protein per gel was ∼105 μg. Protein spots appearing in red were more abundant in the cell surface-exposed proteome 60 min after bile addition, and proteins spots more abundant before bile addition appear in green. Protein spots appearing in yellow showed no differences in abundance between the two time points. The numbered protein spots (22–43) were identified as above and are listed in Table II.
Fig. 4.
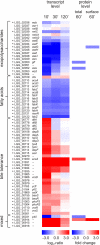
Expression changes in selected genes coding for cell envelope- and bile tolerance-related functions. Changes at the transcript level are represented as log2 intensity ratio values 10, 30, and 120 min (′) after bile addition compared with the time point preceding the bile addition, and statistically significant changes (p < 0.01 at any time point) are marked with asterisks (*). Protein abundance changes in the total proteome and in the surface-exposed proteome are represented as -fold changes (standardized abundance 60 min after bile addition/right before bile addition). All the represented changes in protein abundances are statistically significant (p < 0.01 for total proteome; p < 0.05 for surfome).
Fig. 5.
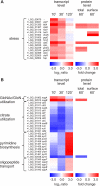
Expression changes in selected genes coding for stress proteins (A) and central metabolic functions (B). Changes in transcript levels are represented as log2 intensity ratio values 10, 30, and 120 min (′) after bile addition compared with the time point preceding the bile addition, and statistically significant changes (p < 0.01 at any time point) are marked with asterisks (*). Protein abundance changes in the total proteome and in the surface-exposed proteome are represented as -fold changes (standardized abundance 60 min after bile addition/right before bile addition). All the represented changes in protein abundances are statistically significant (p < 0.01 for total proteome; p < 0.05 for surfome).
Fig. 6.
Model for physiological responses of GG to bile stress. The increased and decreased expression is represented by + and −, respectively.
Similar articles
- Effect of acid stress on protein expression and phosphorylation in Lactobacillus rhamnosus GG.
Koponen J, Laakso K, Koskenniemi K, Kankainen M, Savijoki K, Nyman TA, de Vos WM, Tynkkynen S, Kalkkinen N, Varmanen P. Koponen J, et al. J Proteomics. 2012 Feb 2;75(4):1357-74. doi: 10.1016/j.jprot.2011.11.009. Epub 2011 Nov 16. J Proteomics. 2012. PMID: 22119544 - Proteomics fingerprints of systemic mechanisms of adaptation to bile in Lactobacillus fermentum.
Ali SA, Singh P, Tomar SK, Mohanty AK, Behare P. Ali SA, et al. J Proteomics. 2020 Feb 20;213:103600. doi: 10.1016/j.jprot.2019.103600. Epub 2019 Dec 2. J Proteomics. 2020. PMID: 31805390 - Integrated transcriptomic and proteomic analysis of the bile stress response in probiotic Lactobacillus salivarius LI01.
Lv LX, Yan R, Shi HY, Shi D, Fang DQ, Jiang HY, Wu WR, Guo FF, Jiang XW, Gu SL, Chen YB, Yao J, Li LJ. Lv LX, et al. J Proteomics. 2017 Jan 6;150:216-229. doi: 10.1016/j.jprot.2016.08.021. Epub 2016 Aug 30. J Proteomics. 2017. PMID: 27585996 - Adaptation factors of the probiotic Lactobacillus rhamnosus GG.
Lebeer S, Vanderleyden J, De Keersmaecker SC. Lebeer S, et al. Benef Microbes. 2010 Nov;1(4):335-42. doi: 10.3920/BM2010.0032. Benef Microbes. 2010. PMID: 21831772 Review. - Probiotics in digestive diseases: focus on Lactobacillus GG.
Pace F, Pace M, Quartarone G. Pace F, et al. Minerva Gastroenterol Dietol. 2015 Dec;61(4):273-92. Minerva Gastroenterol Dietol. 2015. PMID: 26657927 Review.
Cited by
- The Listeria monocytogenes Bile Stimulon under Acidic Conditions Is Characterized by Strain-Specific Patterns and the Upregulation of Motility, Cell Wall Modification Functions, and the PrfA Regulon.
Guariglia-Oropeza V, Orsi RH, Guldimann C, Wiedmann M, Boor KJ. Guariglia-Oropeza V, et al. Front Microbiol. 2018 Feb 6;9:120. doi: 10.3389/fmicb.2018.00120. eCollection 2018. Front Microbiol. 2018. PMID: 29467736 Free PMC article. - Molecular Mechanisms of Lacticaseibacillus rhamnosus, LGG® Probiotic Function.
Leser T, Baker A. Leser T, et al. Microorganisms. 2024 Apr 14;12(4):794. doi: 10.3390/microorganisms12040794. Microorganisms. 2024. PMID: 38674738 Free PMC article. Review. - An Exopolysaccharide-Deficient Mutant of Lactobacillus rhamnosus GG Efficiently Displays a Protective Llama Antibody Fragment against Rotavirus on Its Surface.
Álvarez B, Krogh-Andersen K, Tellgren-Roth C, Martínez N, Günaydın G, Lin Y, Martín MC, Álvarez MA, Hammarström L, Marcotte H. Álvarez B, et al. Appl Environ Microbiol. 2015 Sep 1;81(17):5784-93. doi: 10.1128/AEM.00945-15. Epub 2015 Jun 19. Appl Environ Microbiol. 2015. PMID: 26092449 Free PMC article. - Phylogenomics and comparative genomics of Lactobacillus salivarius, a mammalian gut commensal.
Harris HMB, Bourin MJB, Claesson MJ, O'Toole PW. Harris HMB, et al. Microb Genom. 2017 Jun 13;3(8):e000115. doi: 10.1099/mgen.0.000115. eCollection 2017 Aug. Microb Genom. 2017. PMID: 29026656 Free PMC article. - An L-Fucose Operon in the Probiotic Lactobacillus rhamnosus GG Is Involved in Adaptation to Gastrointestinal Conditions.
Becerra JE, Yebra MJ, Monedero V. Becerra JE, et al. Appl Environ Microbiol. 2015 Jun;81(11):3880-8. doi: 10.1128/AEM.00260-15. Epub 2015 Mar 27. Appl Environ Microbiol. 2015. PMID: 25819967 Free PMC article.
References
- Qin J., Li R., Raes J., Arumugam M., Burgdorf K. S., Manichanh C., Nielsen T., Pons N., Levenez F., Yamada T., Mende D. R., Li J., Xu J., Li S., Li D., Cao J., Wang B., Liang H., Zheng H., Xie Y., Tap J., Lepage P., Bertalan M., Batto J. M., Hansen T., Le Paslier D., Linneberg A., Nielsen H. B., Pelletier E., Renault P., Sicheritz-Ponten T., Turner K., Zhu H., Yu C., Li S., Jian M., Zhou Y., Li Y., Zhang X., Li S., Qin N., Yang H., Wang J., Brunak S., Doré J., Guarner F., Kristiansen K., Pedersen O., Parkhill J., Weissenbach J., MetaHIT Consortium, Bork P., Ehrlich S. D., Wang J. (2010) A human gut microbial gene catalogue established by metagenomic sequencing. Nature 464, 59–65 - PMC - PubMed
- Ley R. E., Peterson D. A., Gordon J. I. (2006) Ecological and evolutionary forces shaping microbial diversity in the human intestine. Cell 124, 837–848 - PubMed
- Marco M. L., Pavan S., Kleerebezem M. (2006) Towards understanding molecular modes of probiotic action. Curr. Opin. Biotechnol. 17, 204–210 - PubMed
- van Baarlen P., Troost F. J., van Hemert S., van der Meer C., de Vos W. M., de Groot P. J., Hooiveld G. J., Brummer R. J., Kleerebezem M. (2009) Differential NF-kappaB pathways induction by Lactobacillus plantarum in the duodenum of healthy humans correlating with immune tolerance. Proc. Natl. Acad. Sci. U.S.A. 106, 2371–2376 - PMC - PubMed
Publication types
MeSH terms
Substances
LinkOut - more resources
Full Text Sources


