Regulation of fat specific protein 27 by isoproterenol and TNF-α to control lipolysis in murine adipocytes - PubMed (original) (raw)
Regulation of fat specific protein 27 by isoproterenol and TNF-α to control lipolysis in murine adipocytes
Srijana Ranjit et al. J Lipid Res. 2011 Feb.
Abstract
The lipid droplet-associated fat specific protein 27 (FSP27) suppresses lipolysis and thereby enhances triglyceride accumulation in adipocytes. We and others have recently found FSP27 to be a remarkably short-lived protein (half-life, 15 min) due to its rapid ubiquitination and proteasomal degradation. Thus, we tested the hypothesis that lipolytic agents such as tumor necrosis factor-α (TNF-α) and isoproterenol modulate FSP27 levels to regulate FFA release. Consistent with this concept, we showed that the lipolytic actions of TNF-α, interleukin-1β (IL-1β), and IFN-γ are accompanied by marked decreases in FSP27 expression and lipid droplet size in mouse adipocytes. Similar depletion of FSP27 using short interfering RNA (siRNA) mimicked the lipolysis-enhancing effect of TNF-α, while maintaining stable FSP27 levels using expression of hemagglutinin epitope-tagged FSP27 blocked TNF-α-mediated lipolysis. In contrast, we show the robust lipolytic action of isoproterenol is paradoxically associated with increases in FSP27 levels and a delayed degradation rate corresponding to decreased ubiquitination. This catecholamine-mediated increase in FSP27 abundance, probably a feedback mechanism for restraining excessive lipolysis by catecholamines, is mimicked by forskolin or 8-bromo-cAMP treatment and is prevented by the protein kinase A (PKA) inhibitor KT5720 or by PKA depletion using siRNA. Taken together, these data identify the regulation of FSP27 as an important intermediate in the mechanism of lipolysis in adipocytes in response to TNF-α and isoproterenol.
Figures
Fig. 1.
FSP27 has a short half-life and is degraded by the proteasome after ubiquitination. A: Representative Western blots of adipocyte lysates following 15, 30, and 60 min treatments with 5 µg/ml cycloheximide (CHX) compared with untreated (0) cells show rapid degradation of FSP27. B: Densitometric measurement of FSP27 protein levels after cycloheximide treatment (as shown in panel A). C: Representative Western blots of FSP27 show protection of FSP27 from degradation in lysates from cells treated with the proteasome inhibitor MG132 but not by peptidase inhibitor leupeptin (Leu) or aprotinin (Aprot) or lysosomal inhibitor NH4Cl. D: Densitometric measurements showing protection of FSP27 by MG132. E: FSP27 immunoblot (IB) of total lysates of 3T3-L1 adipocytes with or without MG132. F: Lysates from control (−) or MG132-treated (+) cells were immunoprecipitated (IP) with anti-FSP27 antibody (FSP27) or nonimmune rabbit IgG (IgG), and immunoprecipitates were probed with anti-ubiquitin (Ub) monoclonal antibody. G: Immunoprecipitates (as shown in panel F) probed with anti-FSP27 antibody. Data shown are representative of four or more separate experiments.
Fig. 2.
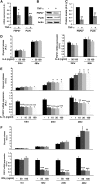
TNF-α as well as IL-1β and IFN-γ but not IL-6 decrease FSP27 levels and increase glycerol release in 3T3-L1 adipocytes. A–C: Cells treated with 10 ng/ml TNF-α for 16 h. A: Quantitative RT-PCR of Fsp27 and perilipin mRNA levels; B) representative immunoblot of FSP27, perilipin, and actin (loading control); C: densitometric quantitation of immunoblots of FSP27 and perilipin protein levels. A–C, Data are expressed as means ± SEM for six different experiments; P values were calculated using Student's _t_-test; *, P < 0.05; **, P < 0.0005. A.U., arbitrary units. D: 3T3-L1 adipocytes were treated with IL-6 at the indicated concentrations and times. D, left panel, glycerol release; D, right panel, quantitative RT-PCR of FSP27 mRNA levels. E, F: Cells treated with IL1-β or IFN-γ, respectively, at the indicated concentrations. and times are shown. Upper panels, glycerol release; lower panels, quantitative RT-PCR of FSP27 mRNA levels. D–F, Data are expressed as means ± SEM from three to five experiments performed in duplicate. P values were calculated using Student's _t_-test relative to the time-matched untreated condition; *, P < 0.05; **, P < 0.01; ***, P < 0.001.
Fig. 3.
TNF-α also decreases FSP27 levels and increases glycerol release in adipocytes isolated from mouse adipose tissue. A: Primary adipocytes were isolated from subcutaneous adipose tissue of C57Bl/6J mice and treated with 10 ng/ml TNF-α for 20 or 40 h. A, left panel: glycerol released into medium; right panel: quantitative RT-PCR of FSP27 mRNA level (shown as a percentage of the time-matched untreated sample). Data are expressed as means ± SEM from two different experiments performed in duplicate. A.U., arbitrary units. B: Primary preadipocytes from the SVF were induced to differentiate as described in Materials and Methods. Mature adipocytes were then treated with 10–20 ng/ml TNF-α for 24 or 48 h. B, left panel: glycerol release; B, right panel: quantitative RT-PCR. Data are expressed as means ± SEM from one experiment performed three to five times. P values were calculated using Student's _t_-test relative to the time-matched untreated condition; *, P < 0.05; **, P < 0.01; ***, P < 0.001.
Fig. 4.
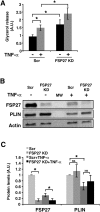
TNF-α treatment of 3T3-L1 adipocytes increases lipolysis that is enhanced by further depletion of FSP27 using siRNA. A: Glycerol released in medium was measured in 3T3-L1 adipocytes electroporated with scrambled (Scr) or FSP27 siRNA and treated with 10 ng/ml TNF-α for 16 h. A.U., arbitrary units. B: Western blot analysis using FSP27, perilipin (PLIN), and actin antibodies showing FSP27 and PLIN protein levels in control and under TNF-α-treated conditions. MW, molecular weight. C: Densitometric analysis of FSP27 and PLIN protein levels in siRNA or TNF-α-treated cells. Data are expressed as means ± SEM for six different experiments. KD, knock-down. P values were calculated using ANOVA; *, P < 0.05; **, P < 0.0005.
Fig. 5.
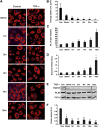
TNF-α-mediated decrease in FSP27 is associated with reduced lipid droplet size and increased glycerol release. Mature 3T3-L1 adipocytes were treated with TNF-α for 30 min, 1 h, 2 h, 4 h, 8 h, and 16 h. A: Confocal microscope images showing lipid droplets stained with Oil Red O (red) and nuclei stained with DAPI (blue). Images are representative of 90 random fields imaged from three different experiments. B: Quantification of lipid droplet volume using MetaMorph imaging software. Data are means ± SEM of 10 cells for each condition from different experiments. Con, control. C: Quantification of numbers of lipid droplets per cell for each time point. D: Glycerol released into medium after 10 ng/ml TNF-α treatment for 30 min, 1 h, 2 h, 4 h, 8 h, and 16 h. E: Western blot analysis showing FSP27 levels after 10 ng/ml TNF-α treatment for 30 min, 1 h, 2 h, 4 h, 8 h, and 16 h. F: Densitometry showing decrease of FSP27 protein levels after TNF-α treatment. Data are expressed as means ± SEM from three different experiments. P values were calculated using ANOVA;*, P < 0.05; **, P < 0.005.
Fig. 6.
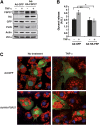
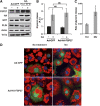
Adenoviral expression of FSP27 protects against TNF-α-mediated lipolysis and lipid droplet size diminution. 3T3-L1 adipocytes were infected with control virus (Ad-GFP) or HA-FSP27-expressing virus (Ad-HA-FSP27) on the fourth day of differentiation. On the fifth day, cells were serum starved overnight, treated with 10 ng/ml TNF-α for 24 h, and analyzed for protein, glycerol release, and lipid droplet morphology. A: Western blot analysis using FSP27, HA, GFP, perilipin (PLIN), actin, and Vti1a antibodies show maintenance of HA-tagged FSP27 protein levels even after treatment of TNF-α. Actin is the loading control for HA, GFP, and PLIN, and Vti1a is the loading control for FSP27. B: Glycerol released into the medium in 24 h with or without TNF-α treatment. A. U., arbitrary units. C: Confocal microscopy image showing lipid droplets stained with Oil Red O (red), nuclei stained with DAPI (blue), and GFP expression (green) in 3T3-L1 adipocytes expressing Ad-GFP or Ad-HA-FSP27 in the presence or absence of TNF-α. Data are expressed as means ± SEM for five individual experiments. P values were calculated using ANOVA; *, P < 0.05; **, P < 0.0005.
Fig. 7.
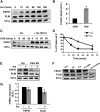
Isoproterenol delays degradation of FSP27 to increase protein level in 3T3-L1 adipocytes. A: Lysates from adipocytes treated with 10 µM isoproterenol (Iso) for 15, 30, 60, 120, or 180 min were immunoblotted for FSP27, perilipin (PLIN), or Vti1a (loading control). B: Densitometry of immunoblot shows increased FSP27 protein level after 180 min of 10 µM isoproterenol treatment of mature adipocytes. A.U., arbitrary units; Con, control. C: Mature adipocytes treated with 10 µM isoproterenol, pulsed with 5 µg/ml cycloheximide (CHX), and chased for 15, 30, and 60 min show delayed degradation of FSP27 in the presence of isoproterenol compared with that of control (0). D: Densitometry of FSP27 level in the presence or absence of 10 µM isoproterenol shows delayed FSP27 degradation in the presence of isoproterenol. E: Adipocytes transfected with either Scr or PKA siRNA and treated with or without 10 µM isoproterenol. The effect of isoproterenol on FSP27 is abrogated when PKA is knocked down (KD). The absence of perilipin phosphorylation despite isoproterenol treatment in adipocytes treated with PKA siRNA is used as the positive control. F: Mature adipocytes were treated with 10 µM isoproterenol, 5 µM forskolin (For), 1 mM 8-bromo-cAMP (B-cAMP) plus IBMX, or 80 µM KT5720 plus 10 µM isoproterenol. The effect of isoproterenol on FSP27 is mimicked by forskolin and 8-bromo-cAMP and inhibited by KT5720. G: Mature adipocytes treated with 10 µM isoproterenol were harvested for RNA and analyzed for FSP27 mRNA. It shows no change in FSP27 transcript with isoproterenol treatment. Data are expressed as means ± SEM for six individual experiments.
Fig. 8.
Expression of adenoviral FSP27 protects against isoproterenol-mediated lipid droplet size diminution but not lipolysis. The 3T3-L1 adipocytes were infected with control virus (Ad-GFP) or HA-FSP27-expressing virus (Ad-HA-FSP27) on the fourth day of differentiation. On the fifth day, cells were serum starved overnight, treated with 10 µM isoproterenol (Iso) for 3 h, and analyzed for protein, glycerol release, and lipid droplet morphology. A: Western blot analysis using FSP27, HA, GFP, PLIN, Actin, and Vti1a antibodies. Actin is the loading control for HA, GFP, and PLIN, and Vti1a is the loading control for FSP27. B: Glycerol released into the medium in 3 h with or without isoproterenol. C: Difference in the rate of glycerol released [calculated using the equation (FSP27 KD + Iso) – (Scr + iso), where KD is knockdown] in response to isoproterenol from 3T3-L1 adipocytes treated with Scr or FSP27 siRNA shows increased rate of lipolysis at 3 h compared with 1 h. D: Confocal microscopy image shows lipid droplets stained with Oil Red O (red), nuclei stained with DAPI (blue), and GFP (green) expression in 3T3-L1 adipocytes expressing Ad-GFP or Ad-HA-FSP27 in the presence or absence of isoproterenol. Data are expressed as means ± SEM for three individual experiments. P values were calculated using ANOVA for data shown in panel B and Student's _t_-test for data shown in panel C; *, P < 0.05.
Fig. 9.
Isoproterenol (Iso) alters ubiquitination of FSP27 to modulate FSP27 in 3T3-L1 adipocytes. Mature adipocytes were treated with MG132 alone or with TNF-α or isoproterenol, FSP27- immunoprecipitated using FSP27 antibody, and probed with ubiquitin and FSP27 antibody. A: Western blot showing total lysate of adipocytes treated with MG132 alone or with TNF-α or isoproterenol. B: FSP27 immunoprecipitated (IP) with FSP27 antibody and probed with ubiquitin (Ub) antibody. C: FSP27 immunoprecipitated with FSP27 antibody and probed with FSP27 antibody. Data are representative of four separate experiments. Lanes G, IgG; lanes F, FSP27.
Similar articles
- Curcumin attenuates lipolysis stimulated by tumor necrosis factor-α or isoproterenol in 3T3-L1 adipocytes.
Xie XY, Kong PR, Wu JF, Li Y, Li YX. Xie XY, et al. Phytomedicine. 2012 Dec 15;20(1):3-8. doi: 10.1016/j.phymed.2012.09.003. Epub 2012 Oct 17. Phytomedicine. 2012. PMID: 23083815 - Metformin reduces lipolysis in primary rat adipocytes stimulated by tumor necrosis factor-alpha or isoproterenol.
Ren T, He J, Jiang H, Zu L, Pu S, Guo X, Xu G. Ren T, et al. J Mol Endocrinol. 2006 Aug;37(1):175-83. doi: 10.1677/jme.1.02061. J Mol Endocrinol. 2006. PMID: 16901933 - Assessment of fat-specific protein 27 in the adipocyte lineage suggests a dual role for FSP27 in adipocyte metabolism and cell death.
Kim JY, Liu K, Zhou S, Tillison K, Wu Y, Smas CM. Kim JY, et al. Am J Physiol Endocrinol Metab. 2008 Apr;294(4):E654-67. doi: 10.1152/ajpendo.00104.2007. Epub 2008 Jan 15. Am J Physiol Endocrinol Metab. 2008. PMID: 18198355 - Overexpression of perilipin A and B blocks the ability of tumor necrosis factor alpha to increase lipolysis in 3T3-L1 adipocytes.
Souza SC, de Vargas LM, Yamamoto MT, Lien P, Franciosa MD, Moss LG, Greenberg AS. Souza SC, et al. J Biol Chem. 1998 Sep 18;273(38):24665-9. doi: 10.1074/jbc.273.38.24665. J Biol Chem. 1998. PMID: 9733764 - FSP27 contributes to efficient energy storage in murine white adipocytes by promoting the formation of unilocular lipid droplets.
Nishino N, Tamori Y, Tateya S, Kawaguchi T, Shibakusa T, Mizunoya W, Inoue K, Kitazawa R, Kitazawa S, Matsuki Y, Hiramatsu R, Masubuchi S, Omachi A, Kimura K, Saito M, Amo T, Ohta S, Yamaguchi T, Osumi T, Cheng J, Fujimoto T, Nakao H, Nakao K, Aiba A, Okamura H, Fushiki T, Kasuga M. Nishino N, et al. J Clin Invest. 2008 Aug;118(8):2808-21. doi: 10.1172/JCI34090. J Clin Invest. 2008. PMID: 18654663 Free PMC article.
Cited by
- Endoplasmic Reticulum Stress-Associated Lipid Droplet Formation and Type II Diabetes.
Zhang X, Zhang K. Zhang X, et al. Biochem Res Int. 2012;2012:247275. doi: 10.1155/2012/247275. Epub 2012 Feb 28. Biochem Res Int. 2012. PMID: 22506114 Free PMC article. - The role of lipid droplets in metabolic disease in rodents and humans.
Greenberg AS, Coleman RA, Kraemer FB, McManaman JL, Obin MS, Puri V, Yan QW, Miyoshi H, Mashek DG. Greenberg AS, et al. J Clin Invest. 2011 Jun;121(6):2102-10. doi: 10.1172/JCI46069. Epub 2011 Jun 1. J Clin Invest. 2011. PMID: 21633178 Free PMC article. Review. - Impact of microRNA Regulated Macrophage Actions on Adipose Tissue Function in Obesity.
Matz A, Qu L, Karlinsey K, Zhou B. Matz A, et al. Cells. 2022 Apr 14;11(8):1336. doi: 10.3390/cells11081336. Cells. 2022. PMID: 35456015 Free PMC article. Review. - Pathogenesis of Insulin Resistance and Atherogenic Dyslipidemia in Nonalcoholic Fatty Liver Disease.
Akhtar DH, Iqbal U, Vazquez-Montesino LM, Dennis BB, Ahmed A. Akhtar DH, et al. J Clin Transl Hepatol. 2019 Dec 28;7(4):362-370. doi: 10.14218/JCTH.2019.00028. Epub 2019 Nov 29. J Clin Transl Hepatol. 2019. PMID: 31915606 Free PMC article. Review. - Eosinophils support adipocyte maturation and promote glucose tolerance in obesity.
Lee EH, Itan M, Jang J, Gu HJ, Rozenberg P, Mingler MK, Wen T, Yoon J, Park SY, Roh JY, Choi CS, Park WJ, Munitz A, Jung Y. Lee EH, et al. Sci Rep. 2018 Jul 2;8(1):9894. doi: 10.1038/s41598-018-28371-4. Sci Rep. 2018. PMID: 29967467 Free PMC article.
References
- Wang S., Soni K. G., Semache M., Casavant S., Fortier M., Pan L., Mitchell G. A. 2008. Lipolysis and the integrated physiology of lipid energy metabolism. Mol. Genet. Metab. 95: 117–126. - PubMed
- Ducharme N. A., Bickel P. E. 2008. Lipid droplets in lipogenesis and lipolysis. Endocrinology. 149: 942–949. - PubMed
- Wolins N. E., Brasaemle D. L., Bickel P. E. 2006. A proposed model of fat packaging by exchangeable lipid droplet proteins. FEBS Lett. 580: 5484–5491. - PubMed
- Miura S., Gan J. W., Brzostowski J., Parisi M. J., Schultz C. J., Londos C., Oliver B., Kimmel A. R. 2002. Functional conservation for lipid storage droplet association among Perilipin, ADRP, and TIP47 (PAT)-related proteins in mammals, Drosophila, and Dictyostelium. J. Biol. Chem. 277: 32253–32257. - PubMed
- Gronke S., Beller M., Fellert S., Ramakrishnan H., Jackle H., Kuhnlein R. P. 2003. Control of fat storage by a Drosophila PAT domain protein. Curr. Biol. 13: 603–606. - PubMed
Publication types
MeSH terms
Substances
Grants and funding
- DK-30898/DK/NIDDK NIH HHS/United States
- R01 DK060837/DK/NIDDK NIH HHS/United States
- DK-60837/DK/NIDDK NIH HHS/United States
- R37 DK030898/DK/NIDDK NIH HHS/United States
- DK0822574/DK/NIDDK NIH HHS/United States
- R01 DK030898/DK/NIDDK NIH HHS/United States
LinkOut - more resources
Full Text Sources

