Intracellular localization and splicing regulation of FUS/TLS are variably affected by amyotrophic lateral sclerosis-linked mutations - PubMed (original) (raw)
Intracellular localization and splicing regulation of FUS/TLS are variably affected by amyotrophic lateral sclerosis-linked mutations
Yoshihiro Kino et al. Nucleic Acids Res. 2011 Apr.
Abstract
TLS (translocated in liposarcoma), also known as FUS (fused in sarcoma), is an RNA/DNA-binding protein that plays regulatory roles in transcription, pre-mRNA splicing and mRNA transport. Mutations in TLS are responsible for familial amyotrophic lateral sclerosis (ALS) type 6. Furthermore, TLS-containing intracellular inclusions are found in polyglutamine diseases, sporadic ALS, non-SOD1 familial ALS and a subset of frontotemporal lobar degeneration, indicating a pathological significance of TLS in a wide variety of neurodegenerative diseases. Here, we identified TLS domains that determine intracellular localization of the murine TLS. Among them, PY-NLS located in the C-terminus is a strong determinant of intracellular localization as well as splicing regulation of an E1A-derived minigene. Disruption of PY-NLS promoted the formation of cytoplasmic granules that were partially overlapped with stress granules and P-bodies. Some of the ALS-linked mutations altered both intracellular localization and splicing regulation of TLS, while most mutations alone did not affect splicing regulation. However, phospho-mimetic substitution of Ser505 (or Ser513 in human) could enhance the effects of ALS mutations, highlighting interplay between post-translational modification and ALS-linked mutations. These results demonstrate that ALS-linked mutations can variably cause loss of nuclear functions of TLS depending on the degree of impairment in nuclear localization.
Figures
Figure 1.
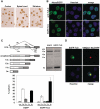
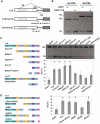
Characterization of EGFP-TLS as a model protein. (A) Immunohistochemical analysis of endogenous TLS cerebral cortex, spinal cord and striatum of mouse at the age of 16 weeks. Sections were stained using anti-TLS-C polyclonal antibody. Scale bar represents 20 µm. (B) Intracellular localization of endogenous and recombinant TLS in N2A cells. Endogenous TLS was immunostained with a polyclonal antibody against a C-terminal region of TLS and detected by the fluorescence of Alexa 488 conjugated to the secondary antibody (upper panels). EGFP-TLS was transfected into N2a cells and detected by the fluorescence of EGFP (lower panels). Images were obtained by confocal fluorescence microscopy. Hoechst33342 was used for staining the nucleus. (C) Structures of the E1A minigene (top left). Spliced and unspliced products are depicted. Splicing assay of E1A minigene of N2a cell transfected with either EGFP or EGFP-TLS (top right). Bottom, quantified results of E1A splicing assay. Bars represent spliced or unspliced products (mean ± SD, n = 3). (D) Sequestration of EGFP-TLS by huntingtin exon 1 containing 108Q fused with NLS and RFP. Confocal fluorescent images of EGFP and RFP are shown together with nuclear staining with Hoechst 33342. Scale bars in (B) and (D) represent 10 µm.
Figure 2.
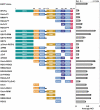
Summary of intracellular localization of EGFP-TLS deletion mutants. Structure and intracellular localization of EGFP-TLS deletion mutants in N2a cells are described. Protein domains of TLS are indicated by colored boxes. Average nucleocytoplasmic index (NCI) values determined for each mutant are shown in the chart (mean ± SD, n = 3).
Figure 3.
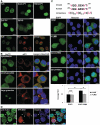
Characterization of PY-NLS and NES of TLS. (A) Intracellular localization of N-terminally deleted mutants and QSYG in N2a cells (top and middle panels). Exclusion of EGFP-TLS from the nucleoli immunostained by anti-nucleolin (Ncl) antibody (bottom panels). (B) Examples of intracellular localization of the Δex15 mutant. Cells were immunostained by anti-eIF3 antibody (red). (C) Confocal images of RRM (with or without leptomycin B treatment), Grich-RRM and Grich-RGG1 fragments. Predicted leucine-rich NES sequences in human and mouse TLS are shown in the top. The consensus sequence of NES is also shown with essential residues in red. Phi represents hydrophobic amino acids, whereas X represents any of amino acids. Bar chart shows the effect of leptomycin B (LMB) treated at 20 nM for 1 h (mean ± SD, n = 3). *P < 0.01 in ANOVA and Tukey's test. n.s.: not significantly changed. (D) Effect of pathway–specific inhibition of nuclear import of TLS. Cells were transfected with RFP-M9M and the localization of endogenous TLS was detected by anti-TLS-C antibody. Arrows indicate cells with higher RFP-M9M expression. Arrowheads indicate cells with little or no RFP-M9M. Scale bars represent 10 µm. Hoechst33342 was used for nuclear staining.
Figure 4.
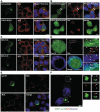
Cytoplasmic localization of TLS. (A) Grich-RGG3 and RGG2-RGG3 are sufficient for formation of SG-like large granular structures. N2a cells were immunostained by anti-eIF3 antibody. (B) Top panels show the intracellular localization of RGG2-RGG3ΔZnF. The ZnF motif is dispensable for formation of SG-like granules (arrows). Bottom panels show the accumulation of RGG2-RGG3ΔZnF in the nucleolus. Nucleoli were detected by anti-Ncl antibody. (C) Cytoplasmic accumulation of NES-TLS. Small (top panels) or large (bottom panels) granules were observed. Large granules were positive for anti-eIF3. (D) Partial overlap of TLSΔex15 small granules with PBs in N2a cells. Transfected cells were immunostained with anti-Rck (red) and anti-eIF3 (blue). Right panels are magnified images of the boxed region in the left panels. Arrows indicate TLS small granules overlapped with PBs. Arrowheads indicate TLS small granules not overlapped with PBs. eIF3 was not enriched in TLS small granules. Scale bars represent 10 µm. (E) PBs are depleted in N2a cells with higher accumulation of Δex15. PBs were immunostained by anti-Rck. Bottom left panel is identical to top right panel with an exception that the shape of the cell with strong expression of Δex15 is emphasized by a dashed line. Flanking cells without Δex15 fluorescence contain PBs. (F) Interaction between large granules of Δex15 and P-bodies. Cells were immunostained with anti-Rck antibody to visualize PBs in COS-7 cells. Magnified images of indicated regions are also shown (a and b). Scale bars represent 10 µm.
Figure 5.
Splicing assay of EGFP-TLS using a variant of the E1A minigene. (A) Structure of variant minigenes of E1A. Mut13s and mut12s were made by substation of E1A minigene at the 5′-splice site of 13s and 12s, respectively. (B) RT–PCR results of splicing assay using E1A/mut13s and E1A/mut12s in N2a cells. Minigenes were transfected with either EGFP or EGFP-TLS. (C) Comparative analysis of TLS deletion mutants using E1A/mut12s. Structures of mutants are shown in the left. Representative gel image of RT–PCR is shown. Bars represent the ratio of the 9s spliced product (mean ± SD, n = 4–7). (D) Splicing regulation of TLS internal deletion mutants. The structure of mutants is shown in the left. Bar chart shows the results of splicing assay as in (C) (n = 3–7). *P < 0.05, ANOVA and Dunnett's test in comparison with EGFP.
Figure 6.
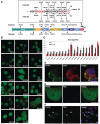
Intracellular localization of ALS-linked mutants of EGFP-TLS. (A) ALS-linked mutations examined in this study. Mouse TLS mutations corresponding to known human mutations are indicated. Consensus residues of PY-NLS are shown in red and underlined. Residues encoded by exon 15 are boxed. (B) Intracellular localization of EGFP-TLS harboring above mutations in N2a cells. (C) Bars represent the average NCI (mean ± SD, n = 3) of ALS-linked mutants in untreated N2a cells (red bars) or actinomycin D-treated N2a cells (gray bars). *P < 0.05 in ANOVA and Dunnett's test in comparison with TLS. Red and dark asterisks indicate significant difference from TLS in the absence and presence of ActD, respectively. (D) An example of cytoplasmic granular structures formed by TLS mutants. (E) Partial colocalization of EGFP-P517L and PBs. EGFP-P517L showed partial colocalization with granules immunoreactive with anti-Rck. (F) Cells with higher expression of EGFP-P517L (arrows) showed a reduced number of PBs. PBs were immunostained by anti-Rck antibody. Scale bars represent 10 µm in (B, D, E and F).
Figure 7.
Splicing regulation of ALS-linked mutants of EGFP-TLS. (A) Quantification of splicing assay results using E1A/mut12s. Bars represent the ratio of 9S (mean ± SD). All TLS mutants except for K502E, R514G and P517L exhibited statistically significant difference from EGFP (P < 0.01), while K502E, R514G and P517L were different from wild-type TLS (*P < 0.01, ANOVA and Tukey's test. n = 4–7). (B) The expression levels of TLS mutants. EGFP-TLS mutants were detected using anti-GFP antibody in a western blot analysis. Bar chart shows the relative protein levels of wild-type or mutant EGFP-TLS that were normalized by LaminB (mean ± SD, n = 4). No significant difference from the wild-type was detected by ANOVA and Dunnett's test. G158E reproducibly showed slightly slower migration compared to the others.
Figure 8.
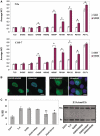
Phospho-mimetic substitution at Ser505 variably enhances the effects of ALS-linked mutations. (A) Intracellular localization of TLS and its mutants with or without S505D substitution in N2a (top) or COS-7 (bottom) cells. Bars represent average NCI values (mean ± SD, n = 3). For each mutant, open and red bars indicate non-substituted S505 and S505D, respectively. *P < 0.05 in comparison with S505 in two-tailed _t_-test. (B) Intracellular localization of S505D/H509Q (left panels) and S505D/H509P (right panels) in N2a cells. Scale bar indicates 10 µm. (C) S505D substitution modulates splicing regulation of E1A/mut12s in N2a cells. Bars represent the ratio of the 9s spliced product as in Figure 5 (mean ± SD, n = 3). TLS, S505D and S505D/H509Q showed significantly higher ratio of 9s compared to EGFP (P < 0.05). On the other hand, S505D and S505D/H509Q was not significantly different from TLS. In addition, S505D/H509P and S505D/R510K showed significantly decreased activity compared to TLS, with a greater extent for S505D/H509P (**P < 0.01 and *P < 0.05, ANOVA and Tukey's test).
Figure 9.
Structural determinants of the properties of TLS and the effects of C-terminal ALS-linked mutations. (A) Roles and interplays of TLS internal domains. The effects of each domain found in this study are depicted. See discussion for detail. (B) Classification of C-terminal ALS mutations. C-terminal mutations could be clearly divided into two groups, PY-NLS consensus mutations and non-consensus mutations. The order of the effects among mutants was based on Figures 6C, 8A,
Supplementary Figure S3B and C
. The sequence of the PY-NLS region is shown as in Figure 6A.
Similar articles
- FUS/TLS-immunoreactive neuronal and glial cell inclusions increase with disease duration in familial amyotrophic lateral sclerosis with an R521C FUS/TLS mutation.
Suzuki N, Kato S, Kato M, Warita H, Mizuno H, Kato M, Shimakura N, Akiyama H, Kobayashi Z, Konno H, Aoki M. Suzuki N, et al. J Neuropathol Exp Neurol. 2012 Sep;71(9):779-88. doi: 10.1097/NEN.0b013e318264f164. J Neuropathol Exp Neurol. 2012. PMID: 22878663 - ALS mutations in TLS/FUS disrupt target gene expression.
Coady TH, Manley JL. Coady TH, et al. Genes Dev. 2015 Aug 15;29(16):1696-706. doi: 10.1101/gad.267286.115. Epub 2015 Aug 6. Genes Dev. 2015. PMID: 26251528 Free PMC article. - Nuclear transport impairment of amyotrophic lateral sclerosis-linked mutations in FUS/TLS.
Ito D, Seki M, Tsunoda Y, Uchiyama H, Suzuki N. Ito D, et al. Ann Neurol. 2011 Jan;69(1):152-62. doi: 10.1002/ana.22246. Epub 2010 Dec 8. Ann Neurol. 2011. PMID: 21280085 - Fused in sarcoma (FUS): an oncogene goes awry in neurodegeneration.
Dormann D, Haass C. Dormann D, et al. Mol Cell Neurosci. 2013 Sep;56:475-86. doi: 10.1016/j.mcn.2013.03.006. Epub 2013 Apr 2. Mol Cell Neurosci. 2013. PMID: 23557964 Review. - Physiological functions and pathobiology of TDP-43 and FUS/TLS proteins.
Ratti A, Buratti E. Ratti A, et al. J Neurochem. 2016 Aug;138 Suppl 1:95-111. doi: 10.1111/jnc.13625. Epub 2016 Jun 15. J Neurochem. 2016. PMID: 27015757 Review.
Cited by
- FUS/TLS deficiency causes behavioral and pathological abnormalities distinct from amyotrophic lateral sclerosis.
Kino Y, Washizu C, Kurosawa M, Yamada M, Miyazaki H, Akagi T, Hashikawa T, Doi H, Takumi T, Hicks GG, Hattori N, Shimogori T, Nukina N. Kino Y, et al. Acta Neuropathol Commun. 2015 Apr 25;3:24. doi: 10.1186/s40478-015-0202-6. Acta Neuropathol Commun. 2015. PMID: 25907258 Free PMC article. - Arginine methylation next to the PY-NLS modulates Transportin binding and nuclear import of FUS.
Dormann D, Madl T, Valori CF, Bentmann E, Tahirovic S, Abou-Ajram C, Kremmer E, Ansorge O, Mackenzie IR, Neumann M, Haass C. Dormann D, et al. EMBO J. 2012 Nov 14;31(22):4258-75. doi: 10.1038/emboj.2012.261. Epub 2012 Sep 11. EMBO J. 2012. PMID: 22968170 Free PMC article. - High-content RNAi screening identifies the Type 1 inositol triphosphate receptor as a modifier of TDP-43 localization and neurotoxicity.
Kim SH, Zhan L, Hanson KA, Tibbetts RS. Kim SH, et al. Hum Mol Genet. 2012 Nov 15;21(22):4845-56. doi: 10.1093/hmg/dds321. Epub 2012 Aug 7. Hum Mol Genet. 2012. PMID: 22872699 Free PMC article. - Post-transcriptional Regulation of Gene Expression via Unproductive Splicing.
Zavileyskiy LG, Pervouchine DD. Zavileyskiy LG, et al. Acta Naturae. 2024 Jan-Mar;16(1):4-13. doi: 10.32607/actanaturae.27337. Acta Naturae. 2024. PMID: 38698955 Free PMC article. - Amyotrophic Lateral Sclerosis Genes in Drosophila melanogaster.
Layalle S, They L, Ourghani S, Raoul C, Soustelle L. Layalle S, et al. Int J Mol Sci. 2021 Jan 18;22(2):904. doi: 10.3390/ijms22020904. Int J Mol Sci. 2021. PMID: 33477509 Free PMC article. Review.
References
- Rabbitts TH, Forster A, Larson R, Nathan P. Fusion of the dominant negative transcription regulator CHOP with a novel gene FUS by translocation t(12;16) in malignant liposarcoma. Nat. Genet. 1993;4:175–180. - PubMed
- Ichikawa H, Shimizu K, Hayashi Y, Ohki M. An RNA-binding protein gene, TLS/FUS, is fused to ERG in human myeloid leukemia with t(16;21) chromosomal translocation. Cancer Res. 1994;54:2865–2868. - PubMed
- Crozat A, Aman P, Mandahl N, Ron D. Fusion of CHOP to a novel RNA-binding protein in human myxoid liposarcoma. Nature. 1993;363:640–644. - PubMed
- Zinszner H, Albalat R, Ron D. A novel effector domain from the RNA-binding protein TLS or EWS is required for oncogenic transformation by CHOP. Genes Dev. 1994;8:2513–2526. - PubMed
- Doi H, Okamura K, Bauer PO, Furukawa Y, Shimizu H, Kurosawa M, Machida Y, Miyazaki H, Mitsui K, Kuroiwa Y, et al. RNA-binding protein TLS is a major nuclear aggregate-interacting protein in huntingtin exon 1 with expanded polyglutamine-expressing cells. J. Biol. Chem. 2008;283:6489–6500. - PubMed
Publication types
MeSH terms
Substances
LinkOut - more resources
Full Text Sources
Other Literature Sources
Medical
Molecular Biology Databases
Miscellaneous
