Sequence-dependent sorting of recycling proteins by actin-stabilized endosomal microdomains - PubMed (original) (raw)
Sequence-dependent sorting of recycling proteins by actin-stabilized endosomal microdomains
Manojkumar A Puthenveedu et al. Cell. 2010.
Abstract
The functional consequences of signaling receptor endocytosis are determined by the endosomal sorting of receptors between degradation and recycling pathways. How receptors recycle efficiently, in a sequence-dependent manner that is distinct from bulk membrane recycling, is not known. Here, in live cells, we visualize the sorting of a prototypical sequence-dependent recycling receptor, the beta-2 adrenergic receptor, from bulk recycling proteins and the degrading delta-opioid receptor. Our results reveal a remarkable diversity in recycling routes at the level of individual endosomes, and indicate that sequence-dependent recycling is an active process mediated by distinct endosomal subdomains distinct from those mediating bulk recycling. We identify a specialized subset of tubular microdomains on endosomes, stabilized by a highly localized but dynamic actin machinery, that mediate this sorting, and provide evidence that these actin-stabilized domains provide the physical basis for a two-step kinetic and affinity-based model for protein sorting into the sequence-dependent recycling pathway.
Copyright © 2010 Elsevier Inc. All rights reserved.
Figures
Figure 1. B2AR is enriched in endosomal tubular domains devoid of DOR
A) HEK293 cells stably expressing FLAG-B2AR, labeled with fluorescently-tagged anti-FLAG antibodies, were followed by live confocal imaging before (left) and after 5 min (right) of isoproterenol treatment. Arrows show internal endosomes. B) Example endosomes showing tubular domains enriched in B2AR (arrowheads), with one enlarged in the inset. C) Examples of DOR endosomes. DOR is smoothly distributed on the endosomal membrane, and is not detected in tubules. D) Average fluorescence of B2AR (red circles) and TfR (green diamonds) calculated across multiple tubules (n= 123 for B2AR, 100 for TfR). B2AR shows a 50% enrichment over the endosomal membrane, while TfR is not enriched. Each point denotes an individual tubule, the bar denotes the mean, and the grey dotted line denotes the fluorescence of the endosomal membrane. E) An endosome containing both internalized B2AR and DOR, showing a tubule containing B2AR but no detectable DOR (arrowheads). F) Trace of linear pixel values across the same endosome, normalized to the maximum, confirms that the tubule is enriched for B2AR but not DOR. G) Linear pixel values of endosomal tubules averaged across 11 endosomes show specific enrichment of B2AR in tubules. Error bars are s.e.m. See also Fig S1 and movies S1 and S2.
Figure 2. Membranes derived from endosomal tubules deliver B2AR to the cell surface
A) Frames from a representative time lapse series showing scission of a vesicle that contains B2AR but not detectable DOR, from an endosomal tubule. B) An image plane close to the plasma membrane in cells co-expressing SpH-B2AR and FLAG-B2AR (labeled with Alexa555), exposed to isoproterenol for 5 min, and imaged by fast dual-color confocal microscopy. Arrows denote the FLAG-B2AR-containing membrane derived from the endosomal tubule that fuses. C) Fluorescence trace of the B2AR-containing membranes from the endosome in movie S4, showing the spike in SpH-B2AR fluorescence (fusion) followed by rapid loss of fluorescence. Scale bars are 1μm. See also Fig S1 and movies S3 and S4.
Figure 3. B2AR tubules are marked by a highly localized actin cytoskeleton
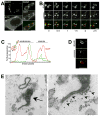
A) Cells co-expressing fluorescently labeled B2AR and actin-GFP exposed to isoproterenol for 5 min. The boxed area is enlarged in the inset, with arrowheads indicating specific concentration of actin on B2AR endosomal tubules. B) Time lapse series from an example endosome with B2AR and coronin-GFP. Coronin is detectable on the endosomal tubule (arrows) and on the vesicle (arrowheads) that buds off the endosome. C) A trace of linear pixel values across the same endosome, normalized to maximum fluorescence, shows coronin on the endosomal domain and the vesicle. D) Example structured illumination image of a B2AR endosome showing specific localization of coronin to a B2AR tubule (arrowheads) E) Electron micrograph of an HRP-positive endosome (arrow) showing actin filaments (labeled with 9nm gold, arrowheads) along a tubule. The right panel shows an enlarged view. See also movies S5 and S6.
Figure 4. Actin on B2AR tubules is dynamic and Arp2/3-nucleated
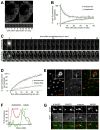
A) Cells expressing actin-GFP imaged live after treatment with 10 μM latrunculin for the indicated times, show rapid loss of endosomal actin. A time series of the boxed area, showing several endosomal actin loci, is shown at the lower panel. B) The change in endosomal and cytoplasmic actin fluorescence over time after latrunculin normalized to initial endosomal actin fluorescence (n=10). One-phase exponential curve fits (solid lines) show a t1/2 of 3.5 sec for actin loss (R2= 0.984, d.f= 23, Sy.x= 2.1 for endosomal actin, R2= 0.960, d.f= 23, Sy.x= 1.9 for cytoplasmic). Endosomal and cytoplasmc actin fluorescence becomes statistically identical within 15 sec after latrunculin. Error bars denote s.e.m. C) Time series showing FRAP of representative examples of endosomal actin (top) and stress fibers (bottom). D) Kinetics of FRAP of actin (mean ± s.e.m) quantified from 14 endosomes and 17 stress fibers. One-phase exponential curve fits (lines), show a t1/2 of 8.26 sec for endosomal actin (R2= 0.973, d.f= 34, Sy.x= 4.8) and 50.35 sec for stress fibers (R2= 0.801, d.f= 34, Sy.x= 3.9). E) Example endosomes in live cells co-expressing B2AR and Arp3-GFP showing Arp3 at the base of B2AR tubules (arrowhead in the inset). F) Trace of linear pixel fluorescence of B2AR and Arp3 shows Arp3 specifically on the endosomal tubule. G) Example endosomes from cells co-expressing B2AR and N-WASP-, WAVE2-, cortactin-, or WASH-GFP. N-WASP and WAVE2 were not detected on endosomes, while cortactin and WASH were concentrated at the B2AR tubules (arrowheads). Scale bars are 1μm. See also Fig S2 and movie S7.
Figure 5. B2AR is enriched specifically in a subset of endosomal tubules that are stabilized by actin
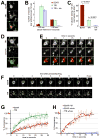
A) A representative example of an endosome with two tubules containing TfR, only one of which is enriched for B2AR. B) The number of tubules with B2AR, TfR, and TfR in the presence of 10 μM latrunculin, per endosome per min, binned into lifetimes less than or more than 30 sec, quantified across 28 endosomes and 281 tubules. C) The percentages of B2AR, TfR, and TfR + latrunculin tubules with lifetimes less than or more than 30 sec, normalized to total number of tubules in each case. D) An example endosome containing TfR and coronin, showing that coronin is present on a subset of the TfR tubules. Arrowheads indicate a TfR tubule that is marked by coronin, and arrows show a TfR tubule that is not. E) Time lapse series showing TfR-containing tubules extruding from endosomal domains without detectable cortactin. Arrowheads indicate a relatively stable TfR tubule that is marked by coronin, and arrows denote rapid transient TfR tubules without detectable cortactin. F) Frames from a representative time lapse movie showing FRAP of B2AR (top row) or TfR (bottom row). The circles mark the bleached area of the endosome. TfR fluorescence recovers rapidly, while B2AR fluorescence recovers slowly. G) Fluorescence recovery of B2AR (red circles) and TfR (green diamonds) on endosomes quantified from 11 experiments. Exponential fits (solid lines) show that B2AR fluorescence recovers with a t1/2 of 25.77 sec (R2= 0.83, d.f= 37, Sy.x= 6.3), while TfR fluorescence recovers with a t1/2 of 6.21 sec (R2= 0.91, d.f= 30, Sy.x= 7.1). H) Fluorescence recovery of B2AR (blue triangles) and TfR (green diamonds) on endosomes when the whole endosome was bleached, or of B2AR on the cell surface (red circles) quantified from 12 experiments. B2AR fluorescence on the surface recovers with a t1/2 of 6.49 sec (R2= 0.94, d.f= 27, Sy.x= 8.1). Error bars denote s.e.m. Scale bars are 1μm. See also Fig S3 and movie S8.
Figure 6. B2AR enrichment in tubules depends on endosomal actin and a PDZ-interacting sequence on the B2AR cytoplasmic domain
A) Representative fields from B2AR-expressing cells exposed to isoproterenol showing B2AR endosomes before (top panel) or after (bottom panel) exposure to 10 μM latrunculin for 5 min. Tubular endosomal domains enriched in B2AR (arrowheads) are lost upon exposure to latrunculin. B) Schematic of measurement of endosomal B2AR fluorescence profiles in the limiting membrane. The profile was measured in a clockwise manner starting from the area diametrically opposite the tubule (an angle of 0 ). C) B2AR concentration along the endosomal membrane, calculated from fluorescence profiles of 20 endosomes, normalized to the average endosomal B2AR fluorescence. In the presence of latrunculin, B2AR enrichment in tubules is abolished, and B2AR fluorescence shows little variation along the endosomal membrane. D) Variance in endosomal B2AR fluorescence values measured before and after latrunculin. B2AR distribution becomes more uniform after latrunculin. E) The percentages of endosomes extruding B2AR-containing tubules, calculated before (n=246) and after (n= 106) treatment with latrunculin, or before (n=141) and after (n=168) cytochalasin-D, show a significant reduction after treatment with either drug. As a control, the percentages of endosomes extruding TfR-containing tubules before (n= 317) and after (n= 286) respectively are shown. F) Cortactin immunoblot showing reduction in protein levels after siRNA. G) Representative fields from B2AR-containing endosomes in cells treated with control and cortactin siRNA. Arrowheads denote endosomal tubules in the control siRNA-treated cells. H) Percentages of endosomes extruding B2AR tubules calculated in control siRNA-treated cells (n=210), cortactin siRNA-treated cells (n=269), and cortactin siRNA-treated cells expressing an siRNA-resistant cortactin (n=250). I) Representative examples of endosomes from agonist-exposed cells expressing B2AR, B2AR-ala, DOR, or DOR-B2. Arrowheads denote receptor-containing tubules on B2AR and DOR-B2 endosomes. J) The percentage of endosomes with tubular domains containing B2AR, B2AR-ala, DOR, DOR-B2, or DOR-ABD (n= 246, 302, 137, 200, and 245 respectively) were quantified. Scale bars are 1μm, and error bars are s.e.m. See also Fig S4.
Comment in
- Endocytosis: Sorting the recycling.
David R. David R. Nat Rev Mol Cell Biol. 2011 Jan;12(1):3. doi: 10.1038/nrm3038. Nat Rev Mol Cell Biol. 2011. PMID: 21179055 No abstract available.
Similar articles
- Src regulates sequence-dependent beta-2 adrenergic receptor recycling via cortactin phosphorylation.
Vistein R, Puthenveedu MA. Vistein R, et al. Traffic. 2014 Nov;15(11):1195-205. doi: 10.1111/tra.12202. Epub 2014 Sep 8. Traffic. 2014. PMID: 25077552 Free PMC article. - Distinct G protein-coupled receptor recycling pathways allow spatial control of downstream G protein signaling.
Bowman SL, Shiwarski DJ, Puthenveedu MA. Bowman SL, et al. J Cell Biol. 2016 Sep 26;214(7):797-806. doi: 10.1083/jcb.201512068. Epub 2016 Sep 19. J Cell Biol. 2016. PMID: 27646272 Free PMC article. - Rapid recycling of beta-adrenergic receptors is dependent on the actin cytoskeleton and myosin Vb.
Millman EE, Zhang H, Zhang H, Godines V, Bean AJ, Knoll BJ, Moore RH. Millman EE, et al. Traffic. 2008 Nov;9(11):1958-71. doi: 10.1111/j.1600-0854.2008.00813.x. Epub 2008 Aug 9. Traffic. 2008. PMID: 18785920 Free PMC article. - Endosome biogenesis is controlled by ER and the cytoskeleton at tripartite junctions.
Striepen JF, Voeltz GK. Striepen JF, et al. Curr Opin Cell Biol. 2023 Feb;80:102155. doi: 10.1016/j.ceb.2023.102155. Epub 2023 Feb 26. Curr Opin Cell Biol. 2023. PMID: 36848759 Review. - Endosomal microdomains: Formation and function.
Norris A, Grant BD. Norris A, et al. Curr Opin Cell Biol. 2020 Aug;65:86-95. doi: 10.1016/j.ceb.2020.02.018. Epub 2020 Apr 1. Curr Opin Cell Biol. 2020. PMID: 32247230 Free PMC article. Review.
Cited by
- Retromer-mediated endosomal protein sorting: all WASHed up!
Seaman MN, Gautreau A, Billadeau DD. Seaman MN, et al. Trends Cell Biol. 2013 Nov;23(11):522-8. doi: 10.1016/j.tcb.2013.04.010. Epub 2013 May 28. Trends Cell Biol. 2013. PMID: 23721880 Free PMC article. Review. - Mechanisms of selective G protein-coupled receptor localization and trafficking.
Kunselman JM, Lott J, Puthenveedu MA. Kunselman JM, et al. Curr Opin Cell Biol. 2021 Aug;71:158-165. doi: 10.1016/j.ceb.2021.03.002. Epub 2021 May 7. Curr Opin Cell Biol. 2021. PMID: 33965654 Free PMC article. Review. - Coordination of force-generating actin-based modules stabilizes and remodels membranes in vivo.
Heydecker M, Shitara A, Chen D, Tran DT, Masedunskas A, Tora MS, Ebrahim S, Appaduray MA, Galeano Niño JL, Bhardwaj A, Narayan K, Hardeman EC, Gunning PW, Weigert R. Heydecker M, et al. J Cell Biol. 2024 Nov 4;223(11):e202401091. doi: 10.1083/jcb.202401091. Epub 2024 Aug 22. J Cell Biol. 2024. PMID: 39172125 - Identification of novel transplantable GPCR recycling motif for drug discovery.
Nooh MM, Mancarella S, Bahouth SW. Nooh MM, et al. Biochem Pharmacol. 2016 Nov 15;120:22-32. doi: 10.1016/j.bcp.2016.09.011. Epub 2016 Sep 16. Biochem Pharmacol. 2016. PMID: 27645110 Free PMC article. - Regulation of late endosomal/lysosomal maturation and trafficking by cortactin affects Golgi morphology.
Kirkbride KC, Hong NH, French CL, Clark ES, Jerome WG, Weaver AM. Kirkbride KC, et al. Cytoskeleton (Hoboken). 2012 Sep;69(9):625-43. doi: 10.1002/cm.21051. Epub 2012 Jul 31. Cytoskeleton (Hoboken). 2012. PMID: 22991200 Free PMC article.
References
- Brown MS, Anderson RG, Goldstein JL. Recycling receptors: the round-trip itinerary of migrant membrane proteins. Cell. 1983;32:663–7. - PubMed
- Cao TT, Deacon HW, Reczek D, Bretscher A, von Zastrow M. A kinase-regulated PDZ-domain interaction controls endocytic sorting of the β 2-adrenergic receptor. Nature. 1999;401:286–290. - PubMed
- Cullen PJ. Endosomal sorting and signalling: an emerging role for sorting nexins. Nat Rev Mol Cell Biol. 2008;9:574–82. - PubMed
Publication types
MeSH terms
Substances
Grants and funding
- R37 DA010711/DA/NIDA NIH HHS/United States
- K99 DA024698/DA/NIDA NIH HHS/United States
- R01 GM084040/GM/NIGMS NIH HHS/United States
- R00 DA024698-02/DA/NIDA NIH HHS/United States
- R29 DA010711/DA/NIDA NIH HHS/United States
- R00 DA024698/DA/NIDA NIH HHS/United States
- R01 DA010711/DA/NIDA NIH HHS/United States
- K99/R00 DA024698/DA/NIDA NIH HHS/United States
- R01 GM084040-03/GM/NIGMS NIH HHS/United States
LinkOut - more resources
Full Text Sources
Other Literature Sources


