A mesoderm-derived precursor for mesenchymal stem and endothelial cells - PubMed (original) (raw)
A mesoderm-derived precursor for mesenchymal stem and endothelial cells
Maxim A Vodyanik et al. Cell Stem Cell. 2010.
Abstract
Among the three embryonic germ layers, the mesoderm is a major source of the mesenchymal precursors giving rise to skeletal and connective tissues, but these precursors have not previously been identified and characterized. Using human embryonic stem cells directed toward mesendodermal differentiation, we show that mesenchymal stem/stromal cells (MSCs) originate from a population of mesodermal cells identified by expression of apelin receptor. In semisolid medium, these precursors form FGF2-dependent compact spheroid colonies containing mesenchymal cells with a transcriptional profile representative of mesoderm-derived embryonic mesenchyme. When transferred to adherent cultures, individual colonies give rise to MSC lines with chondro-, osteo-, and adipogenic differentiation potentials. Although the MSC lines lacked endothelial potential, endothelial cells could be derived from the mesenchymal colonies, suggesting that, similar to hematopoietic cells, MSCs arise from precursors with angiogenic potential. Together, these studies identified a common precursor of mesenchymal and endothelial cells, mesenchymoangioblast, as the source of mesoderm-derived MSCs.
Copyright © 2010 Elsevier Inc. All rights reserved.
Figures
Figure 1. Identification of mesenchymal colony-forming cells
(A) Development of MS and BL colonies in semisolid culture. Scale bar, 100 μm. (B) Kinetics of MS-, BL- and Hem- (hematopoietic) CFCs in H1 hESC/OP9 coculture. Error bars, standard deviation of 6 independent experiments. (C) The effect of adding cytokines to clonogenic cultures on MS and BL colony formation. ActA is activin A. Bars represent standard deviation of four independent experiments. * p < 0.01. See also Figure S1 and S2.
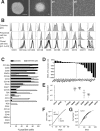
Figure 2. Characterization of mesenchymal colonies and cell lines derived from them
(A) Derivation of MSC line from individual MS colony. Panels show morphology of MS colony in semisolid media and after placement on fibronectin/collagen-coated dishes, and MCS line after 1st (p1) and 5th (p5) passage. Scale bars, 200 μm. (B) Flow cytometric analysis of MS colonies, polyclonal and 24 individual clonal MSC lines; p4 is passage 4, EMCN is endomucin. (C) Summary of phenotype of MS colonies and MSC lines at passage 5 (p5) as detected by flow cytometry. Bars represent standard deviation of 3 independent experiments. (D) Divergent gene expression profile of MS and BL colonies. Selected transcripts defining mesodermal, mesenchymal and hematopoietic lineages are shown. (E) Quantitative RT-PCR analysis of gene expression in individual MS colonies. Each dot on the graphs represents gene expression level in a single colony. Horizontal lines show average expression levels for all tested colonies (n= 30). (F) Expansion potential of polyclonal cell lines (mean doubling time (dT) and standard deviation for 4 lines are shown). (G) Expansion potential of 10 individual clonal cell lines derived from a single MS colony. See also Figure S3, and S6.
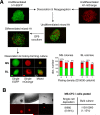
Figure 3. Demonstration of single cell origin of mesenchymal colonies
(A) H1 cells expressing either EGFP or mOrange-H2BB fusion protein were used for preparation of chimeric H1 cell line containing equal proportions of randomly mixed EGFP- and mOrange-positive cells. Graph indicates the numbers of single color (red or green) or mixed (black) colonies in semisolid clonogenic culture at different plating densities. Bars show the absolute numbers of single color (red or green) or mixed (black) colonies in semisolid clonogenic culture counted at different plating densities. The numbers above bars indicate percentage of mixed colonies of total colonies counted. (B) A single cell deposition of APLNR+ HES2.R26tdRFP cells into methylcellulose medium with feeder culture of colony-forming H1 hESCs (104 cells/ml).
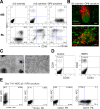
Figure 4. Demonstration of endothelial potential of mesenchymal colonies
(A) Differentiation potential of MS and BL colonies collected on day 12 of clonogenic culture after re-plating on OP9. Flow cytometric analysis demonstrates development of CD146+CD31− mesenchymal, CD31+CD146+CD43− endothelial, and CD43+ hematopoietic lineages. (B) Immunostaining analysis of cell clusters developed from a single MS (top, scale bar, 100 μm) and BL (bottom, scale bar, 50 μm) colony collected on day 5 of clonogenic culture. Cells are identified as CD144(VE-cadherin)+CD43− endothelial, CD43+ hematopoietic and calponin+ CD144− mesenchymal. Scale bars, 100 μm. (C) Vascular tube formation by MS colonies collected on day 6 of clonogenic culture. Scale bar, 200 μm. (D) Effect of the addition of BMP4 to clonogenic media on endothelial potential of individual colonies on OP9. Left upper quadrant numbers show percentage of CD31+ endothelial cells (mean ± SD of 6 independent experiments). (E) Lack of endothelial potential of MSC lines after coculture with OP9. Note MSCs acquire expression of CD34 after coculture with OP9, but CD31+ endothelial cells are not observed. See also Figure S4.
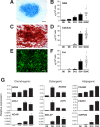
Figure 5. Skeletogenic differentiation potential of MSC lines
Chondrogenesis is shown in (A), by Alcian blue staining, and in (B), by glycosaminoglycan (GAG) production following differentiation in chondrogenic conditions. Osteogenesis is shown in (C), by Alizarin red staining and (D), by calcium accumulation following differentiation in osteogenic conditions. Adipogensis is shown in (E), by Nile red staining and (F), by fat accumulation following differentiation in adipogenic conditions. In (A), (C), and (E), scale bars are 100 μm. In (B), (D), and (F), bars represent standard deviation of mean obtained at indicated time points (Days 0–36 of differentiation) using polyclonal cell lines (n=3). *p< 0.01 as compared to Day 0. Each dot on the graphs represents values by individual clonal cell line on day 24 of differentiation. Horizontal lines show average values for all tested clonal cell lines (n=24). (G) Kinetic analysis of mesenchymal lineage-specific gene expression in polyclonal MSC lines differentiated during 24 days under chondrogenic, osteogenic, and adipogenic conditions as determined by quantitative RT-PCR. Average expression normalized to RPL13A. Bars represent standard deviation of three independent experiments.
Figure 6. Identification of APLNR as a marker of mesoderm generated from hESCs in coculture with OP9
(A) Characterization of H1 hESC-derived APLNR+ cells by flow cytometry. (B) Effect of WNT (DKK-1, dickkopf homolog 1; 150 μg/ml) and TGF-β1 (SB431542; 5 μg/ml) signaling inhibitors on generation of APLNR+ cells. Error bars, standard deviation of 4 independent experiments. (C) Enrichment of mesodermal transcripts in APLNR+ cells isolated on day 3 of differentiation. (D) Frequency of MS- and BL-CFCs in APLNR+ and APLNR− cell fractions isolated at days 2, 2.5 and 3 of hESC/OP9 coculture. Bars represent standard deviation of 3 independent experiments. See also Figure S5.
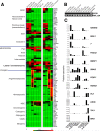
Figure 7. Gene expression profiling of APLNR+ and APLNR− cells, cores, MS and BL colonies and MSC lines (passages p1 and p5) obtained from H1 hESCs differentiated for 2 (D2) or 3 (D3) days in coculture with OP9
(A) Shown are heat maps for selected sets of genes defining indicated germ layers and their subpopulations/derivatives. Cores were collected on day 3 of clonogenic cultures and fully developed colonies on day 12 of clonogenic cultures. EMT is epithelial-mesenchymal transition. VSMC is vascular smooth muscle cells. (B) Lack of SOX1 neuroepithelium marker expression throughout all stages of differentiation. H1 embryonic bodies differentiated for 14 days were used as positive control. (C) Quantitative RT-PCR analysis of representative transcripts in indicated cell subsets. Bars represent gene expression in pooled samples from 3 experiments normalized to RPL13.
Comment in
- A bipotent mesoderm subset identified via colony-forming assay.
Yoder MC. Yoder MC. Cell Stem Cell. 2010 Dec 3;7(6):643-4. doi: 10.1016/j.stem.2010.11.022. Cell Stem Cell. 2010. PMID: 21112556 No abstract available.
Similar articles
- The mesenchymoangioblast, mesodermal precursor for mesenchymal and endothelial cells.
Slukvin II, Kumar A. Slukvin II, et al. Cell Mol Life Sci. 2018 Oct;75(19):3507-3520. doi: 10.1007/s00018-018-2871-3. Epub 2018 Jul 10. Cell Mol Life Sci. 2018. PMID: 29992471 Free PMC article. Review. - Endothelial origin of mesenchymal stem cells.
Slukvin II, Vodyanik M. Slukvin II, et al. Cell Cycle. 2011 May 1;10(9):1370-3. doi: 10.4161/cc.10.9.15345. Epub 2011 May 1. Cell Cycle. 2011. PMID: 21444996 Free PMC article. Review. - Origins and properties of dental, thymic, and bone marrow mesenchymal cells and their stem cells.
Komada Y, Yamane T, Kadota D, Isono K, Takakura N, Hayashi S, Yamazaki H. Komada Y, et al. PLoS One. 2012;7(11):e46436. doi: 10.1371/journal.pone.0046436. Epub 2012 Nov 21. PLoS One. 2012. PMID: 23185234 Free PMC article. - Neural crest and mesoderm lineage-dependent gene expression in orofacial development.
Bhattacherjee V, Mukhopadhyay P, Singh S, Johnson C, Philipose JT, Warner CP, Greene RM, Pisano MM. Bhattacherjee V, et al. Differentiation. 2007 Jun;75(5):463-77. doi: 10.1111/j.1432-0436.2006.00145.x. Epub 2007 Feb 5. Differentiation. 2007. PMID: 17286603 - Mesenchymal stromal cells: inhibiting PDGF receptors or depleting fibronectin induces mesodermal progenitors with endothelial potential.
Ball SG, Worthington JJ, Canfield AE, Merry CL, Kielty CM. Ball SG, et al. Stem Cells. 2014 Mar;32(3):694-705. doi: 10.1002/stem.1538. Stem Cells. 2014. PMID: 24022915 Free PMC article.
Cited by
- Optimizing human endometrial mesenchymal stem cells for maximal induction of angiogenesis.
Zhang J, Song H, Fan X, He S, Yin W, Peng Z, Zhai X, Yang K, Gong H, Wang Z, Ping Y, Zhang S, Li RK, Xie J. Zhang J, et al. Mol Cell Biochem. 2023 Jun;478(6):1191-1204. doi: 10.1007/s11010-022-04572-4. Epub 2022 Oct 20. Mol Cell Biochem. 2023. PMID: 36266491 - Immunity-and-matrix-regulatory cells derived from human embryonic stem cells safely and effectively treat mouse lung injury and fibrosis.
Wu J, Song D, Li Z, Guo B, Xiao Y, Liu W, Liang L, Feng C, Gao T, Chen Y, Li Y, Wang Z, Wen J, Yang S, Liu P, Wang L, Wang Y, Peng L, Stacey GN, Hu Z, Feng G, Li W, Huo Y, Jin R, Shyh-Chang N, Zhou Q, Wang L, Hu B, Dai H, Hao J. Wu J, et al. Cell Res. 2020 Sep;30(9):794-809. doi: 10.1038/s41422-020-0354-1. Epub 2020 Jun 16. Cell Res. 2020. PMID: 32546764 Free PMC article. - Epigenomic analysis of multilineage differentiation of human embryonic stem cells.
Xie W, Schultz MD, Lister R, Hou Z, Rajagopal N, Ray P, Whitaker JW, Tian S, Hawkins RD, Leung D, Yang H, Wang T, Lee AY, Swanson SA, Zhang J, Zhu Y, Kim A, Nery JR, Urich MA, Kuan S, Yen CA, Klugman S, Yu P, Suknuntha K, Propson NE, Chen H, Edsall LE, Wagner U, Li Y, Ye Z, Kulkarni A, Xuan Z, Chung WY, Chi NC, Antosiewicz-Bourget JE, Slukvin I, Stewart R, Zhang MQ, Wang W, Thomson JA, Ecker JR, Ren B. Xie W, et al. Cell. 2013 May 23;153(5):1134-48. doi: 10.1016/j.cell.2013.04.022. Epub 2013 May 9. Cell. 2013. PMID: 23664764 Free PMC article. - Periocular and intra-articular injection of canine adipose-derived mesenchymal stem cells: an in vivo imaging and migration study.
Wood JA, Chung DJ, Park SA, Zwingenberger AL, Reilly CM, Ly I, Walker NJ, Vernau W, Hayashi K, Wisner ER, Cannon MS, Kass PH, Cherry SR, Borjesson DL, Russell P, Murphy CJ. Wood JA, et al. J Ocul Pharmacol Ther. 2012 Jun;28(3):307-17. doi: 10.1089/jop.2011.0166. Epub 2011 Dec 16. J Ocul Pharmacol Ther. 2012. PMID: 22175793 Free PMC article. - Biphasic modulation of insulin signaling enables highly efficient hematopoietic differentiation from human pluripotent stem cells.
Duan F, Huang R, Zhang F, Zhu Y, Wang L, Chen X, Bai L, Guo W, Chang SC, Hu X, Na J. Duan F, et al. Stem Cell Res Ther. 2018 Jul 27;9(1):205. doi: 10.1186/s13287-018-0934-x. Stem Cell Res Ther. 2018. PMID: 30053898 Free PMC article.
References
- Amit M, Carpenter MK, Inokuma MS, Chiu CP, Harris CP, Waknitz MA, Itskovitz-Eldor J, Thomson JA. Clonally derived human embryonic stem cell lines maintain pluripotency and proliferative potential for prolonged periods of culture. Developmental Biology. 2000;227:271–278. - PubMed
- Blazsek I, Chagraoui J, Peault B. Ontogenic emergence of the hematon, a morphogenetic stromal unit that supports multipotential hematopoietic progenitors in mouse bone marrow. Blood. 2000;96:3763–3771. - PubMed
Publication types
MeSH terms
Substances
Grants and funding
- P51 RR000167/RR/NCRR NIH HHS/United States
- R01 HL081962/HL/NHLBI NIH HHS/United States
- P01 GM081629-01A1/GM/NIGMS NIH HHS/United States
- R01 HL081962-03/HL/NHLBI NIH HHS/United States
- U01 HL099773/HL/NHLBI NIH HHS/United States
- P01 GM081629/GM/NIGMS NIH HHS/United States
- P51 RR000167-49/RR/NCRR NIH HHS/United States
LinkOut - more resources
Full Text Sources
Other Literature Sources
Molecular Biology Databases

