Interferon antagonist NSs of La Crosse virus triggers a DNA damage response-like degradation of transcribing RNA polymerase II - PubMed (original) (raw)
Interferon antagonist NSs of La Crosse virus triggers a DNA damage response-like degradation of transcribing RNA polymerase II
Paul Verbruggen et al. J Biol Chem. 2011.
Abstract
La Crosse encephalitis virus (LACV) is a mosquito-borne member of the negative-strand RNA virus family Bunyaviridae. We have previously shown that the virulence factor NSs of LACV is an efficient inhibitor of the antiviral type I interferon system. A recombinant virus unable to express NSs (rLACVdelNSs) strongly induced interferon transcription, whereas the corresponding wt virus (rLACV) suppressed it. Here, we show that interferon induction by rLACVdelNSs mainly occurs through the signaling pathway leading from the pattern recognition receptor RIG-I to the transcription factor IRF-3. NSs expressed by rLACV, however, acts downstream of IRF-3 by specifically blocking RNA polymerase II-dependent transcription. Further investigations revealed that NSs induces proteasomal degradation of the mammalian RNA polymerase II subunit RPB1. NSs thereby selectively targets RPB1 molecules of elongating RNA polymerase II complexes, the so-called IIo form. This phenotype has similarities to the cellular DNA damage response, and NSs was indeed found to transactivate the DNA damage response gene pak6. Moreover, NSs expressed by rLACV boosted serine 139 phosphorylation of histone H2A.X, one of the earliest cellular reactions to damaged DNA. However, other DNA damage response markers such as up-regulation and serine 15 phosphorylation of p53 or serine 1524 phosphorylation of BRCA1 were not triggered by LACV infection. Collectively, our data indicate that the strong suppression of interferon induction by LACV NSs is based on a shutdown of RNA polymerase II transcription and that NSs achieves this by exploiting parts of the cellular DNA damage response pathway to degrade IIo-borne RPB1 subunits.
Figures
FIGURE 1.
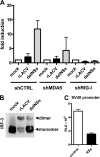
Activation of the RIG-I pathway by LACV and blockade by NSs downstream of IRF-3. A, RIG-I-dependent IFN induction and suppression by NSs is shown. Human 293T cells were treated with retroviral shRNA constructs directed against either MDA5 or RIG-I or against the heat shock 70 interacting protein as control (shCTRL) as described (36). Knockdown cells were transfected for 5 h with 500 ng of p125luc reporter construct encoding the firefly luciferase under control of the IFN-β promoter and 100 ng of pRL-SV40 reporter construct encoding the Renilla luciferase under control of the constitutively active SV40 promoter. Then cells were infected for 18 h with rLACV or rLACVdelNSs or were left uninfected (mock). Specific IFN-β promoter activity was determined by normalizing firefly to Renilla luciferase activities and setting the mock-infected control as 1. Mean values and S.D. from three independent experiments are shown. B, IRF-3 homodimerization is shown. Extracts from cells infected with rLACV or rLACVdelNSs for 16 h were analyzed by nondenaturing gel electrophoresis followed by an immunoblot to detect IRF-3. Positions of IRF-3 monomers and dimers are indicated on the right. C, influence of NSs on the constitutively active SV40 promoter is shown. 293T cells grown in 12 well plates were transfected with 100 ng of pRL-SV40 and 1 μg of either pI.18/3×FLAG_LACV NSs (NSs) or the plasmid pI.18/3×FLAG_ΔMx (control). Renilla luciferase activity was measured after overnight incubation. Mean values and S.D. from three independent experiments are shown. RLU, Renilla luciferase units.
FIGURE 2.
NSs specifically suppresses RNAP II. A–C, real-time RT-PCR analysis is shown. 293T cells were seeded in 12-well plates to 80% confluency. At 1 h before infection, cells were either pretreated with 50 μg/ml cycloheximide (CHX) or left untreated. Then cells were either infected with rLACV or rLACVdelNSs (m.o.i. = 5) or mock-infected or treated with 1 μg/ml actinomycin D (ActD). After 4 h of incubation, total cell RNA was extracted, and real-time RT-PCR was performed using primers specific for γ-actin intron 3 (A), LACV N RNA (B), or the 5.8 S rRNA precursor (C). All values obtained were normalized against γ-actin mRNA levels. Up-regulation of inducible genes is depicted in relation to mock-infected cells. Mean values and S.D. from three independent experiments are shown. D, an in situ run-on assay is shown. HeLa cells were grown on coverslips and infected with rLACV or rLACVdelNSs (m.o.i. = 1) for 8 h. After permeabilization with buffer containing Triton X-100, cells were incubated with buffer containing Br-UTP to label newly synthesized RNA and α-amanitin to quench RNAP II. After 30 min of labeling, cells were fixed and analyzed by immunofluorescence using an antibody against BrU (red signal) and counterstained with DAPI (blue signal). Insets show a magnification of individual nuclei, and arrows indicate the nucleoli containing de novo synthesized RNAP I transcripts.
FIGURE 3.
RPB1 subunit of RNAP II in LACV-infected mammalian and insect cells. A, Vero cells were either mock-infected or infected with rLACV or rLACVdelNSs at 5 plaque-forming units per cell. At 12 h post-infection, cells were lysed and analyzed by Western blot using either phosphospecific antibodies for the CTD heptad residue serine 5 (CTD-p-Ser-5) or serine 2 (CTD-p-Ser-2), an antibody recognizing the N terminus of RPB1 to visualize hypophosphorylated (IIa) and hyperphosphorylated (IIo) forms or an antiserum against the LACV N protein. B, Vero cells were infected with viruses at an m.o.i. of 1 and analyzed by immunofluorescence for the presence of RPB1 CTD-p-Ser-2 (red) or LACV N (green) using specific antibodies. C and D, shown are A. albopictus C6/36 cells infected for 24 h at an m.o.i. of 10 and analyzed by Western blot (C) and immunofluorescence (D) as described for A and B, respectively. Note that the N signal is much stronger in insect cells due to the prolonged infection time.
FIGURE 4.
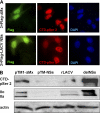
Influence of ectopically expressed LACV NSs on RPB1. A, HeLa cells were seeded on coverslips in 6-well plates and transfected with 1 μg of cDNA expression constructs pI.18/3×FLAG_ΔMx or pI.18/3×FLAG_LACV NSs. After 18 h of incubation, cells were fixed and immunostained for the FLAG tag (green) and the RPB1 CTD-p-Ser-2 (red), and nuclear DNA was counterstained with DAPI (blue). B, BSR-T7/5 cells were transfected with 1 μg of expression constructs pTM-ΔMx or pTM-LACV NSs or infected with LAC viruses (m.o.i. = 5) and analyzed by Western blot after 18 h incubation as indicated for Fig. 3_A_.
FIGURE 5.
Phosphorylation of exogenous CTD sequences in LACV-infected cells. A and B, Vero cells were transfected for 18 h with a cDNA construct expressing the RNAP II CTD fused to EGFP (A) or an EGFP-only plasmid as control (B). Then cells were infected for 24 h with rLACV or rLACVdelNSs (m.o.i. = 0.5), fixed, and permeabilized and immunostained for the presence of RPB1 CTD-p-Ser-2 (red) and LACV N (blue) using specific antibodies. GFP was detected via its autofluorescence activity. Arrows indicate individual cells that are both transfected and infected. C, 293T cells were transfected and infected as in A and analyzed by Western blot using antibodies specific for CTD-p-Ser-2, EGFP, LACV N, and cellular actin. CTD-p-Ser-2 signals of RPB2 and EGFP could be distinguished by their different molecular weights. Note the higher expression levels of GFP compared with GFP-CTD. Most likely, CTD overexpression detracts basal CTD phosphorylation factors away from the RNAP II machinery, as RNAP II CTD phosphorylation is generally reduced in GFP-CTD-transfected cells (compare the first through third lanes with the fourth through sixth lanes in the upper panel).
FIGURE 6.
Time course of RNP IIo and IIa under LACV infection. A, Western blot analysis is shown. Vero cells were either mock-infected or infected with rLACV or rLACVdelNSs (m.o.i. = 5). Samples were taken from 5 to 8 h p.i. every hour and in addition at 12 h and at 16 h p.i. Western blot analysis was performed using an antibody recognizing the N terminus of RPB1 to visualize hypophosphorylated (IIa) and hyperphosphorylated (IIo) forms and antibodies recognizing LACV N or tubulin as infection and loading controls, respectively. B, Western blot signals obtained in A were quantified using an Odyssey imaging system, and relative protein levels (upper panel) and ratios (lower panel) of individual proteins in infected and mock cells were determined. Shown are the mean values and S.D. from two independent Western blots and quantifications.
FIGURE 7.
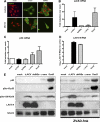
Similarities between LACV NSs action and the DDR. A, proteasome inhibition and the NSs effect on RNAP II is shown. Vero cells grown on coverslips were either infected with rLACV or rLACVdelNSs at an m.o.i. of five or left uninfected (mock). During the infection period of 16 h, cells were either left untreated (upper panel) or kept under 0.5 μ
m
MG132 (lower panel). Then cells were fixed and analyzed by indirect immunofluorescence with antibodies directed against CTD-p-Ser-2 (red) or LACV N (green). B–D, real-time RT-PCR analysis is shown. HeLa cells were either mock-infected, infected with rLACV or rLACVdelNSs (m.o.i. = 5), or treated with 10 μg/ml α-amanitin (α_-ama_) or 0.5 μg/ml doxorubicin (DoxR). After 8 h of incubation, total cell RNA was extracted, and real-time RT-PCR was performed using primers specific for pak6 mRNA (B), p53 mRNA (C), or LACV N RNA (D). All values obtained were normalized against γ-actin mRNA levels. Results shown are triplicates represented as the mean ± S.D. E, Western blot analysis is shown. Vero cells were mock-infected, infected with rLACV, or rLACVdelNSs or treated with α-amanitin or DoxR as indicated above. After 8 h of incubation, cells were lysed, and protein extracts were tested for the presence of p53 protein, p53 Ser-15 phosphorylation, histone H2A.X Ser-139 phosphorylation, LACV N expression, and tubulin levels using appropriate antisera (left panel). In a parallel experiment, infected and treated cells were kept under 100 μ
m
ZVAD-fluoromethyl ketone (fmk) during the whole incubation period (right panel).
Similar articles
- Elongin C Contributes to RNA Polymerase II Degradation by the Interferon Antagonist NSs of La Crosse Orthobunyavirus.
Schoen A, Lau S, Verbruggen P, Weber F. Schoen A, et al. J Virol. 2020 Mar 17;94(7):e02134-19. doi: 10.1128/JVI.02134-19. Print 2020 Mar 17. J Virol. 2020. PMID: 31941775 Free PMC article. - La Crosse bunyavirus nonstructural protein NSs serves to suppress the type I interferon system of mammalian hosts.
Blakqori G, Delhaye S, Habjan M, Blair CD, Sánchez-Vargas I, Olson KE, Attarzadeh-Yazdi G, Fragkoudis R, Kohl A, Kalinke U, Weiss S, Michiels T, Staeheli P, Weber F. Blakqori G, et al. J Virol. 2007 May;81(10):4991-9. doi: 10.1128/JVI.01933-06. Epub 2007 Mar 7. J Virol. 2007. PMID: 17344298 Free PMC article. - Efficient cDNA-based rescue of La Crosse bunyaviruses expressing or lacking the nonstructural protein NSs.
Blakqori G, Weber F. Blakqori G, et al. J Virol. 2005 Aug;79(16):10420-8. doi: 10.1128/JVI.79.16.10420-10428.2005. J Virol. 2005. PMID: 16051834 Free PMC article. - La Crosse virus nonstructural protein NSs counteracts the effects of short interfering RNA.
Soldan SS, Plassmeyer ML, Matukonis MK, González-Scarano F. Soldan SS, et al. J Virol. 2005 Jan;79(1):234-44. doi: 10.1128/JVI.79.1.234-244.2005. J Virol. 2005. PMID: 15596819 Free PMC article. - Inhibition of RNA polymerase II phosphorylation by a viral interferon antagonist.
Thomas D, Blakqori G, Wagner V, Banholzer M, Kessler N, Elliott RM, Haller O, Weber F. Thomas D, et al. J Biol Chem. 2004 Jul 23;279(30):31471-7. doi: 10.1074/jbc.M400938200. Epub 2004 May 17. J Biol Chem. 2004. PMID: 15150262
Cited by
- p53 Activation following Rift Valley fever virus infection contributes to cell death and viral production.
Austin D, Baer A, Lundberg L, Shafagati N, Schoonmaker A, Narayanan A, Popova T, Panthier JJ, Kashanchi F, Bailey C, Kehn-Hall K. Austin D, et al. PLoS One. 2012;7(5):e36327. doi: 10.1371/journal.pone.0036327. Epub 2012 May 4. PLoS One. 2012. PMID: 22574148 Free PMC article. - Toscana virus NSs protein inhibits the induction of type I interferon by interacting with RIG-I.
Gori-Savellini G, Valentini M, Cusi MG. Gori-Savellini G, et al. J Virol. 2013 Jun;87(12):6660-7. doi: 10.1128/JVI.03129-12. Epub 2013 Apr 3. J Virol. 2013. PMID: 23552410 Free PMC article. - La Crosse Virus Neuroinvasive Disease in Children: A Contemporary Analysis of Clinical/Neurobehavioral Outcomes and Predictors of Disease Severity.
Boutzoukas AE, Freedman DA, Koterba C, Hunt GW, Mack K, Cass J, Yildiz VO, de Los Reyes E, Twanow J, Chung MG, Ouellette CP. Boutzoukas AE, et al. Clin Infect Dis. 2023 Feb 8;76(3):e1114-e1122. doi: 10.1093/cid/ciac403. Clin Infect Dis. 2023. PMID: 35607778 Free PMC article. - The Efficacy of the Interferon Alpha/Beta Response versus Arboviruses Is Temperature Dependent.
Lane WC, Dunn MD, Gardner CL, Lam LKM, Watson AM, Hartman AL, Ryman KD, Klimstra WB. Lane WC, et al. mBio. 2018 Apr 24;9(2):e00535-18. doi: 10.1128/mBio.00535-18. mBio. 2018. PMID: 29691338 Free PMC article. - Regulation of the RNAPII Pool Is Integral to the DNA Damage Response.
Tufegdžić Vidaković A, Mitter R, Kelly GP, Neumann M, Harreman M, Rodríguez-Martínez M, Herlihy A, Weems JC, Boeing S, Encheva V, Gaul L, Milligan L, Tollervey D, Conaway RC, Conaway JW, Snijders AP, Stewart A, Svejstrup JQ. Tufegdžić Vidaković A, et al. Cell. 2020 Mar 19;180(6):1245-1261.e21. doi: 10.1016/j.cell.2020.02.009. Epub 2020 Mar 5. Cell. 2020. PMID: 32142654 Free PMC article.
References
- McJunkin J. E., de los Reyes E. C., Irazuzta J. E., Caceres M. J., Khan R. R., Minnich L. L., Fu K. D., Lovett G. D., Tsai T., Thompson A. (2001) N. Engl. J. Med. 344, 801–807 - PubMed
- Rust R. S., Thompson W. H., Matthews C. G., Beaty B. J., Chun R. W. (1999) J. Child Neurol. 14, 1–14 - PubMed
- Whitley R. J., Gnann J. W. (2002) Lancet 359, 507–513 - PubMed
- Centers for Disease Control and Prevention (2005) Confirmed and Probable California Serogroup Viral (Mainly La Crosse) Encephalitis Cases, Human, United States, 1964–2005, by State, www.cdc.gov
- McJunkin J. E., Khan R. R., Tsai T. F. (1998) Infect. Dis. Clin. North. Am. 12, 83–93 - PubMed
Publication types
MeSH terms
Substances
LinkOut - more resources
Full Text Sources
Molecular Biology Databases
Research Materials
Miscellaneous


