MicroRNAs-10a and -10b contribute to retinoic acid-induced differentiation of neuroblastoma cells and target the alternative splicing regulatory factor SFRS1 (SF2/ASF) - PubMed (original) (raw)
MicroRNAs-10a and -10b contribute to retinoic acid-induced differentiation of neuroblastoma cells and target the alternative splicing regulatory factor SFRS1 (SF2/ASF)
Salvador Meseguer et al. J Biol Chem. 2011.
Abstract
MicroRNAs (miRNAs) are an emerging class of non-coding endogenous RNAs involved in multiple cellular processes, including cell differentiation. Treatment with retinoic acid (RA) results in neural differentiation of neuroblastoma cells. We wanted to elucidate whether miRNAs contribute to the gene expression changes induced by RA in neuroblastoma cells and whether miRNA regulation is involved in the transduction of the RA signal. We show here that RA treatment of SH-SY5Y neuroblastoma cells results in profound changes in the expression pattern of miRNAs. Up to 42 different miRNA species significantly changed their expression (26 up-regulated and 16 down-regulated). Among them, the closely related miR-10a and -10b showed the most prominent expression changes. Induction of miR-10a and -10b by RA also could be detected in LA-N-1 neuroblastoma cells. Loss of function experiments demonstrated that miR-10a and -10b are essential mediators of RA-induced neuroblastoma differentiation and of the associated changes in migration, invasion, and in vivo metastasis. In addition, we found that the SR-family splicing factor SFRS1 (SF2/ASF) is a target for miR-10a -and -10b in HeLa and SH-SY5Y neuroblastoma cells. We show here that changes in miR-10a and -10b expression levels may regulate SFRS1-dependent alternative splicing and translational functions. Taken together, our results give support to the idea that miRNA regulation plays a key role in RA-induced neuroblastoma cell differentiation. The discovery of SFRS1 as direct target of miR-10a and -10b supports the emerging functional interaction between two post-transcriptional mechanisms, microRNAs and splicing, in the neuronal differentiation context.
Figures
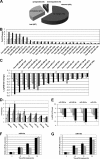
FIGURE 1.
miRNA expression profiling in differentiating SH-SY5Y cells is shown. A, shown is a summary of TaqMan microRNA LDA expression profiling results. B and C, relative expression values are detected in TaqMan microRNA LDA for microRNAs with a false discovery rate of <0.05 at least in two of the three treated versus non-treated comparisons, for up-regulated (B) and down-regulated miRNAs (C). The values for 24 h (empty bars), 48 h (gray bars), and 96 h (black bars) of RA treatment are represented. D and E, RT-qPCR validation experiments for selected up-regulated (D) and down-regulated (E) microRNAs are shown. Data were normalized for the expression of U6 small nuclear RNA, and the relative expression level to the value of 0 h of RA treatment is represented (mean ± S.D. from the two independent determinations). The values for 0 h (empty bars), 24 h (light gray bars), 48 h (dark gray bars), and 96 h (black bars) of RA treatment are shown. F and G, expression levels of miR-10a (F) and -10b (G) during RA treatment of SH-SY5Y and LA-N-1 neuroblastoma cells are shown. The cells were treated with RA for the times indicated in the figure, and the levels of miR-10a and -10b were analyzed by RT-qPCR as indicated for D and E. The graph shows the mean ± S.D. from two independent determinations. Black bars, SH-SY5Y cells. Gray bars, LA-N-1 cells.
FIGURE 2.
Experimental reduction of miR-10a and -10b levels impaired RA-induced morphological differentiation without altering proliferation arrest. A–E, morphological differentiation induced by RA was impaired after experimental reduction of miRNA-10a and -10b levels. Photomicrographs of untransfected cells treated with vehicle (A, ut), untransfected cells treated with RA for 96 h (B, RA), cells transfected with negative control anti-miR and subsequently treated with RA as above (C, NC-am+RA), or cells transfected with anti-miR-10a or -10b and subsequently treated with RA as above (am-10a+RA (D) and am- 10b+RA (E), respectively) are shown. F, shown is RT-qPCR analysis of miRNA-10a and -10b expression levels after transfection of SH-SY5Y cells with anti-miR-10a, -10b and NC anti-miR and subsequent RA treatment for 96 h. For comparison, the values obtained with mock-transfected cells treated with vehicle (mock) or RA (mock+RA) are shown. The graph represents the values obtained from a triplicate experiment (mean ± S.D.). Statistical significance was analyzed by comparing samples transfected with anti-miR-10a or -10b with those transfected with NC-anti-miR. G, miR-10a or -10b knockdown results in reduced RA-induced neurite outgrowth. Quantification of neurite length was performed with Neuron J software (43) on photomicrographs obtained after transfection of SH-SY5Y cells with anti-miR-10a and -10b and NC anti-miR and subsequent RA treatment for 96 h. For comparison, the values obtained with mock-transfected cells treated with vehicle (mock) or RA (mock+RA) are shown. The graph represents the values obtained (mean ± S.E.). At least 100 cells from duplicate photomicrographs were analyzed for each condition. Statistical significance was analyzed by comparing samples transfected with anti-miR-10a or -10b with those transfected with NC-anti-miR. H and I, suppression of miR-10a and -10b expression did not affect the proliferation arrest induced by RA. G, [3H]thymidine incorporation in control mock-transfected SH-SY5Y neuroblastoma cells and after RA treatment for 96 h of mock-transfected cells or cells transfected with NC-anti-miR, anti-miR-10a, or anti-miR-10b. The graph represents the values obtained from triplicate experiments (mean ± S.D.). Statistical significance was analyzed by comparing samples transfected with anti-miR-10a or -10b with those transfected with NC-anti-miR. a.u., arbitrary units. H, shown is the effect of RA treatment and miR-10a or -10b knockdown in the fraction of cells at the S phase of the cell cycle. The percentage of cells in S phase was obtained by analyzing the DNA content by cytometry after staining with propidium Iodide. The effects of RA treatment in cells transfected with NC-anti-miR, anti-miR-10a, or anti-miR-10b were compared with those observed in mock-transfected cells.
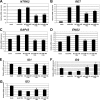
FIGURE 3.
Experimental reduction of miR-10a and -10b levels impaired gene expression changes associated with RA-induced differentiation. RT-qPCR analysis of the mRNA levels of NTRK2 (trkB, A), RET (B), GAP43 (C), ENO2 (neuron-specific enolase, D), ID1 (E), ID2 (F), and ID3 (G) is shown. mRNA expression levels after RA treatment of SH-SY5Y cells transfected with anti-miR-10a and -10b or negative control anti-miR. For comparison, the values obtained with mock-transfected cells treated with vehicle (mock) or with RA (mock+RA) are shown. The graph represents the values obtained from triplicate experiments (mean ± S.D.). Statistical significance was analyzed by comparing samples transfected with anti-miR-10a or -10b with those transfected with NC-anti-miR.
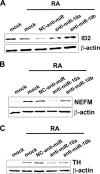
FIGURE 4.
Experimental reduction of miR-10a and -10b levels impaired gene expression changes associated with RA-induced differentiation. Shown is Western blot analysis of the protein levels for ID2 (A) and the neuronal markers neurofilament medium polypeptide (NEFM, B) and tyrosine hydroxylase (TH, C) after RA treatment of SH-SY5Y cells transfected with anti-miR-10a and -10b and NC anti-miR. For comparison, the results obtained with mock-transfected cells treated with vehicle (mock) or with RA (mock+RA) are shown. The filter was re-probed for β-actin as loading control.
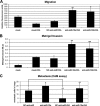
FIGURE 5.
Involvement of miR-10a and -10b on the effects of RA in migratory, invasive, and metastatic potential of neuroblastoma cells. A, migration is shown. Mock-transfected cells and cells transfected with NC anti-miR, anti-miR-10a, or anti-miR-10b were treated with 1 μ
m
RA or vehicle for 96 h. Cells from the different treatment groups were labeled with calcein AM, and migration transwell assays were set as described under “Experimental Procedures.” The graph shows a representative experiment performed in triplicate (mean ± S.D.). Statistical significance was analyzed by comparing samples transfected with anti-miR-10a and -10b with those transfected with NC-anti-miR. B, invasion is shown. Mock-transfected cells and cells transfected with NC anti-miR, anti-miR-10a, or anti-miR-10b were treated with 1 μ
m
RA or vehicle for 96 h. Cells from the different treatment groups were used to set transwell Matrigel invasion assays as described under “Experimental Procedures.” The graph shows the average of three experiments performed in triplicate (mean ± S.D.). Statistical significance was analyzed by comparing samples transfected with anti-miR-10a and -10b with those transfected with NC-anti-miR. C, metastasis is shown. Cells transfected with NC anti-miR or anti-miR-10a were treated with 1 μ
m
RA or vehicle for 96 h. Cells from the different treatment groups were transferred to the upper chorioallantoic membrane (CAM) of 10-day-old chicken embryos and the number of metastasized cells into the lungs was evaluated 7 days later as described under “Experimental Procedures.” The graph represents the values obtained from six parallel assays (mean ± S.D.). Statistical significance was analyzed by comparing samples transfected with anti-miR-10a with those transfected with NC-anti-miR. In addition, samples transfected with NC-anti-miR treated with vehicle were compared with those treated with RA.
FIGURE 6.
Identification and validation of SFRS1- and SFRS10 -3′-UTRs as direct targets of miR-10a and -10b. A and B, shown is the location of the putative miR-10a and -10b target sites in SFRS1 (A) and SFRS10 3′-UTR (B). Unpaired bases are indicated in lowercase above and below the duplex. The predicted Δ_G_ value for this structure is calculated by mFold analysis. Nucleotide numberings in human SFRS1 and SFRS10 mRNAs are according to the corresponding RefSeq entries (NM_006924 and NM_004593, respectively). C and D, shown are the effects of miR-10a and -10b overexpression on the activity of SFRS1- (C) and SFRS10–3′-UTR (D) luciferase reporter constructs in HeLa cells. HeLa cells were co-transfected with pre-miR-10a and -10b or negative control pre-miR. Values (mean ± S.D.) are represented as relative light units obtained from three independent experiments performed in triplicate. Student's t test was used to compare samples transfected with pre-miR-10a and -10b to those transfected with negative control pre-miR. E and F, effects of miR-10a and -10b silencing on the activity of SFRS1- (E) and SFRS10–3′-UTR (F) luciferase reporter constructs in HeLa cells. HeLa cells were co-transfected with anti-miR-10a and -10b or negative control anti-miR. Values (mean ± S.D.) are represented as relative light units obtained from an experiment performed in triplicate. Statistical analysis was performed by comparing samples transfected with anti-miR-10a and -10b to those transfected with negative control anti-miR; ns, non-significant.
FIGURE 7.
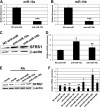
miR-10a/-10b knockdown leads to increased SFRS1 protein and mRNA levels in HeLa and SH-SY5Y cells. A and B, RT-qPCR analysis of miRNA-10a (A) and -10b (B) endogenous expression levels after transfection of HeLa cells with anti-miR-10a, and -10b as compared with NC anti-miR is shown. C, Western blot of SFRS1 protein expression after anti-miR-10a and -10b and NC-anti-miR transfection of HeLa cells is shown. The blot was reprobed with β-actin antibodies as the loading control. D, RT-qPCR analysis of SFRS1 mRNA levels in the same conditions is shown. The graph shows expression levels relative to that of cells transfected with NC-anti-miR (mean ± S.D. of a triplicate experiment). E, Western blot of SFRS1 protein expression after anti-miR-10a and -10b and NC-anti-miR transfection of SH-SY5Y cells followed by 1 μ
m
RA treatment is shown. The blot was reprobed with β-actin antibodies as loading control. F, RT-qPCR analysis of SFRS1 mRNA levels in same conditions is shown. The graph shows expression levels relative to that of RA untreated, NC-anti-miR-transfected cells (mean ± S.D. of a triplicate experiment). Statistical analysis for panels A, B, D, and F was made by comparing the values from cells transfected with anti-miR-10a or -10b to those from cells transfected with NC-anti-miR; ns, non significant.
FIGURE 8.
miR-10a and -10b overexpression leads to a reduction of SFRS1 protein expression in HeLa and SH-SY5Y cells through a decrease of its mRNA levels. A and B, shown is RT-qPCR analysis of miRNA-10a (A) and -10b (B) endogenous levels after transfection of HeLa cells with pre-miR-10a and -10b as compared with NC pre-miR. C, Western blot analysis of SFRS1 protein expression in HeLa cells after transfection of NC pre-miR, pre-miR-10a, or pre-miR-10b. The blot was reprobed with β-actin antibodies as the loading control. D, RT-qPCR analysis of SFRS1 mRNA expression under the same conditions is shown. The graph shows expression levels relative to those of cells transfected with NC-pre-miR (mean ± S.D. of a triplicate experiment). E, shown is a Western blot of SFRS1 protein expression after pre-miR-10a and -10b and NC-pre-miR transfection of SH-SY5Y cells. The blot was reprobed with β-actin antibodies as loading control. F, RT-qPCR analysis of SFRS1 mRNA levels under the same conditions is shown. The graph shows expression levels relative to those of RA-untreated, NC-pre-miR-transfected cells (mean ± S.D. of a triplicate experiment). Statistical analysis for panels A, B, D, and F was made by comparing the values from cells transfected with pre-miR-10a or -10b to those from cells transfected with NC-pre-miR; ns, not significant.
FIGURE 9.
Experimental alteration of miR-10a and -10b levels resulted in an impairment of SFRS1 functions in the regulation of alternative splicing and specific mRNA translation. A, alternative splicing of tau protein exon 10 is altered by transfection of anti-miR-10a and -10b. RT-PCR was performed on RNA extracted from anti-miR-10a and -10b or NC anti-miR-transfected SH-SY5Y cells. tau Exon 10 flanking primers were used in the RT-PCR reaction according to Kondo et al. (64). B, quantification of the percentage of exon 10 inclusion is shown. The graph shows the value (mean ± S.D.) from three independent experiments. Statistical analysis was made by comparing the values from cells transfected with pre-miR-10a or -10b to those from cells transfected with NC-pre-miR. C, a schematic representation of the reporter genes used for the analysis of mRNA translation regulation is shown (adapted from Sanford et al. (34)). D, the effect of the alteration of miR-10a and -10b levels on the translation of the LCS-EDA luciferase reporters is shown. Neuroblastoma cells were transfected in parallel reactions with either the LCS-EDA or the LCS-EDAmt Luciferase reporters and the corresponding pre-miR-10a and -10b or NC-pre-miR together with a promoter-less Renilla luciferase reporter as internal control. After transfection, luciferase activities were determined, and the ratio between the normalized activities of the LCS-EDA and the LCS-EDAmt reporters is represented in the graph for the different transfection groups (mean ± S.D. of two triplicate experiments). Statistical analysis was made by comparing the values from cells transfected with pre-miR-10a or -10b to those from cells transfected with NC-pre-miR.
Similar articles
- Retinoic acid receptors and tissue-transglutaminase mediate short-term effect of retinoic acid on migration and invasion of neuroblastoma SH-SY5Y cells.
Joshi S, Guleria R, Pan J, DiPette D, Singh US. Joshi S, et al. Oncogene. 2006 Jan 12;25(2):240-7. doi: 10.1038/sj.onc.1209027. Oncogene. 2006. PMID: 16158052 - MicroRNAs 10a and 10b are potent inducers of neuroblastoma cell differentiation through targeting of nuclear receptor corepressor 2.
Foley NH, Bray I, Watters KM, Das S, Bryan K, Bernas T, Prehn JH, Stallings RL. Foley NH, et al. Cell Death Differ. 2011 Jul;18(7):1089-98. doi: 10.1038/cdd.2010.172. Epub 2011 Jan 7. Cell Death Differ. 2011. PMID: 21212796 Free PMC article. - A new module in neural differentiation control: two microRNAs upregulated by retinoic acid, miR-9 and -103, target the differentiation inhibitor ID2.
Annibali D, Gioia U, Savino M, Laneve P, Caffarelli E, Nasi S. Annibali D, et al. PLoS One. 2012;7(7):e40269. doi: 10.1371/journal.pone.0040269. Epub 2012 Jul 25. PLoS One. 2012. PMID: 22848373 Free PMC article. - The emerging role of miR-10 family in gastric cancer.
Liu F, Shi Y, Liu Z, Li Z, Xu W. Liu F, et al. Cell Cycle. 2021 Aug;20(15):1468-1476. doi: 10.1080/15384101.2021.1949840. Epub 2021 Jul 7. Cell Cycle. 2021. PMID: 34229543 Free PMC article. Review. - MicroRNA and DNA methylation alterations mediating retinoic acid induced neuroblastoma cell differentiation.
Stallings RL, Foley NH, Bray IM, Das S, Buckley PG. Stallings RL, et al. Semin Cancer Biol. 2011 Oct;21(4):283-90. doi: 10.1016/j.semcancer.2011.07.001. Epub 2011 Jul 13. Semin Cancer Biol. 2011. PMID: 21771658 Free PMC article. Review.
Cited by
- Non-canonical retinoid signaling in neural development, regeneration and synaptic function.
Piazza A, Carlone R, Spencer GE. Piazza A, et al. Front Mol Neurosci. 2024 Mar 7;17:1371135. doi: 10.3389/fnmol.2024.1371135. eCollection 2024. Front Mol Neurosci. 2024. PMID: 38516042 Free PMC article. Review. - Plant serine/arginine-rich proteins: versatile players in RNA processing.
Jia ZC, Das D, Zhang Y, Fernie AR, Liu YG, Chen M, Zhang J. Jia ZC, et al. Planta. 2023 May 5;257(6):109. doi: 10.1007/s00425-023-04132-0. Planta. 2023. PMID: 37145304 Review. - Whole-Transcriptome Analysis of Repeated Low-Level Sarin-Exposed Rat Hippocampus and Identification of Cerna Networks to Investigate the Mechanism of Sarin-Induced Cognitive Impairment.
Shi J, Liu D, Jin Q, Chen X, Zhang R, Shi T, Zhu S, Zhang Y, Zong X, Wang C, Li L. Shi J, et al. Biology (Basel). 2023 Apr 20;12(4):627. doi: 10.3390/biology12040627. Biology (Basel). 2023. PMID: 37106826 Free PMC article. - Splicing Factor SRSF1 Promotes Pancreatitis and KRASG12D-Mediated Pancreatic Cancer.
Wan L, Lin KT, Rahman MA, Ishigami Y, Wang Z, Jensen MA, Wilkinson JE, Park Y, Tuveson DA, Krainer AR. Wan L, et al. Cancer Discov. 2023 Jul 7;13(7):1678-1695. doi: 10.1158/2159-8290.CD-22-1013. Cancer Discov. 2023. PMID: 37098965 Free PMC article. - Physiological tissue-specific and age-related reduction of mouse TDP-43 levels is regulated by epigenetic modifications.
Pacetti M, De Conti L, Marasco LE, Romano M, Rashid MM, Nubiè M, Baralle FE, Baralle M. Pacetti M, et al. Dis Model Mech. 2022 Apr 1;15(4):dmm049032. doi: 10.1242/dmm.049032. Epub 2022 Apr 29. Dis Model Mech. 2022. PMID: 35243489 Free PMC article.
References
- Bartel D. P. (2004) Cell 116, 281–297 - PubMed
- Chekulaeva M., Filipowicz W. (2009) Curr. Opin. Cell Biol. 21, 452–460 - PubMed
- Huang T., Liu Y., Huang M., Zhao X., Cheng L. (2010) J. Mol. Cell Biol. 2, 152–163 - PubMed
Publication types
MeSH terms
Substances
LinkOut - more resources
Full Text Sources
Other Literature Sources
Medical
Research Materials
