DNA-SCARS: distinct nuclear structures that sustain damage-induced senescence growth arrest and inflammatory cytokine secretion - PubMed (original) (raw)
. 2011 Jan 1;124(Pt 1):68-81.
doi: 10.1242/jcs.071340. Epub 2010 Nov 30.
Denise P Muñoz, Robert Teachenor, Victoria Chu, Oanh Le, Dipa Bhaumik, Jean-Philippe Coppé, Eric Campeau, Christian M Beauséjour, Sahn-Ho Kim, Albert R Davalos, Judith Campisi
Affiliations
- PMID: 21118958
- PMCID: PMC3001408
- DOI: 10.1242/jcs.071340
DNA-SCARS: distinct nuclear structures that sustain damage-induced senescence growth arrest and inflammatory cytokine secretion
Francis Rodier et al. J Cell Sci. 2011.
Abstract
DNA damage can induce a tumor suppressive response termed cellular senescence. Damaged senescent cells permanently arrest growth, secrete inflammatory cytokines and other proteins and harbor persistent nuclear foci that contain DNA damage response (DDR) proteins. To understand how persistent damage foci differ from transient foci that mark repairable DNA lesions, we identify sequential events that differentiate transient foci from persistent foci, which we term 'DNA segments with chromatin alterations reinforcing senescence' (DNA-SCARS). Unlike transient foci, DNA-SCARS associate with PML nuclear bodies, lack the DNA repair proteins RPA and RAD51, lack single-stranded DNA and DNA synthesis and accumulate activated forms of the DDR mediators CHK2 and p53. DNA-SCARS form independently of p53, pRB and several other checkpoint and repair proteins but require p53 and pRb to trigger the senescence growth arrest. Importantly, depletion of the DNA-SCARS-stabilizing component histone H2AX did not deplete 53BP1 from DNA-SCARS but diminished the presence of MDC1 and activated CHK2. Furthermore, depletion of H2AX reduced both the p53-dependent senescence growth arrest and p53-independent cytokine secretion. DNA-SCARS were also observed following severe damage to multiple human cell types and mouse tissues, suggesting that they can be used in combination with other markers to identify senescent cells. Thus, DNA-SCARS are dynamically formed distinct structures that functionally regulate multiple aspects of the senescent phenotype.
Figures
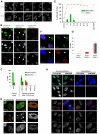
Fig. 1.
Persistent DNA damage foci lack evidence of ssDNA and DNA synthesis. (A) HCA2 [population doubling 25 (PD25)] cells were irradiated with 0.5 or 10 Gy X-rays and followed for the indicated intervals before being fixed and stained for 53BP1. Scale bars: 10 μm. (B) Cells, either untreated or irradiated with 10 Gy, were pulsed with BrdU for the indicated intervals after irradiation before being fixed and stained for 53BP1 (red) and BrdU (green). Arrows indicate cells with BrdU-positive 53BP1 foci. (C) Cell populations in B were analyzed for the percentage of cells synthesizing DNA (BrdU positive throughout the nucleus) and the percentage that harbor BrdU-positive 53BP1 foci (BrdU in foci). Shown are the means ± s.d. from three or more independent measurements. (D) Cells were irradiated with 10 Gy and followed for the indicated intervals before being fixed and stained for 53BP1(red) and RPA70 (RPA, green). Note the RPA70 foci 24 hours after irradiation. (E) Cells treated and stained in D were analyzed for the percentage harboring three or more 53BP1 foci and the percentage with three or more foci positive for both RPA and 53BP1. Shown are the means ± s.d. from three or more independent measurements. (F) Cells were irradiated with 10 Gy. Three hours later, they were pulsed for 4 hours with BrdU, then fixed and stained for Rad51 (red), PML (green) and BrdU (blue). The arrow indicates a BrdU-Rad51-negative cell. (G) Single cells in the cell populations in F were analyzed simultaneously for the presence of nuclear RAD51 foci and nucleoplasmic BrdU. Shown are the means ± s.d. from three or more independent measurements. (H) Cells were given 10 μg/ml bleomycin (BLEO) for 30 minutes and processed 30 minutes later (1 hour BLEO), or induced to senesce by an exposure for 2 hours to 20 μg/ml BLEO and processed 12 days later (SEN-BLEO). Cells were either fixed (‘Non-permeabilized’) or permeabilized before fixation (‘Permeabilized’), then stained for RPA70 (green) and DNA (DAPI, blue) in the top panels or 53BP1 (red), γ-H2AX (green) and PML (blue) in the lower panels.
Fig. 2.
Persistent DNA damage foci accumulate activated DDR mediators. (A) HCA2 cells were either untreated or irradiated (10 Gy). At the indicated intervals thereafter, protein lysates were prepared. 25 μg were analyzed by SDS-PAGE and probed for the indicated proteins by western analysis. Membranes were exposed for different intervals to obtain optimal signals. β-Actin, HSP60 and ponceaux staining (protein) were used as loading controls. (B) Cells were either untreated (‘Control’), cultured to replicative senescence (SnR) or irradiated with 10 Gy and followed for 5 or 24 hours. Cells were fixed and stained for p53-pS15 (panels 1 and 3, green), total p53 (panels 4 and 6, green) or 53BP1 (panels 2 and 5, and panels 3 and 6, red). Yellow indicates merged red and green signals. (C) Early-passage (PD25) HCA2 cells were irradiated with 10 Gy. At the indicated intervals thereafter, the irradiated cells and replicatively senescent (SnR) cells were stained as in B. Cells were scored for three or more p53 or p53-pS15 foci. Shown are the means ± s.d. from three or more independent measurements. (D) Cells were either untreated (‘Control’) or irradiated with 10 Gy and followed for the indicated times before being fixed and stained for 53BP1 (red) and CHK2-pT68 (green) using a rabbit antibody (Cell Signaling #2661, lot #7). Yellow indicates merged red and green signals.
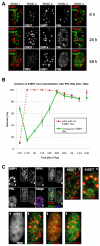
Fig. 3.
DNA-SCARS associate with a subset of PML NBs. (A) HCA2 cells were irradiated with 10 Gy and followed for 6 or 24 hours before being fixed and stained for CREST (panel 2), 53BP1 (panel 3) and PML (panel 4). At 6 and 24 hours, panel 1 shows CREST (green)–53BP1 (red) colocalization (yellow), and panel 5 shows 53BP1 (red)–PML (green) colocalization (yellow). The same cells were also stained for TRF2 (panel 2), 53BP1 (panel 3) and PML (panel 4) 48 hours after irradiation. Panel 1 shows TRF2 (green)–53BP1 (red) colocalization (yellow), and panel 5 shows 53BP1 (red)–PML (green) colocalization (yellow). (B) Cells were irradiated with 10 Gy, then fixed and stained at the indicated intervals thereafter. Cells were scored for the percentage of cells with three or more 53BP1 foci (red line) and the extent to which individual 53BP1 foci totally or partially overlapped with a PML NB (green line). Shown are the means ± s.d. from three or more independent measurements. (C) Cells were irradiated with 10 Gy. Twenty four hours later, they were fixed and stained for 53BP1 (red in merge), RPA (green in merge) and PML (blue in merge). Cells in the selected field, also shown in Fig. 1A for 53BP1 only, were labeled 1–3, and individual colocalizations are shown in the insets (one selected protein is displayed in green, the other red and colocalization in yellow). In cells 2 and 3, colocalization between 53BP1 and PML is shown. For cell 1, which displays RPA foci, all combinations are shown.
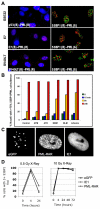
Fig. 4.
DNA-SCARS do not depend on selected DNA repair or signaling proteins. (A) HCA2 cells were infected at PD25 with a lentivirus expressing GSE22, then stained at PD35 for p53 (blue) and PML (red) (upper-left panel) or 53BP1 (red) and PML (green) (upper-right panel). HCA2 cells were infected at PD35 with a retrovirus expressing E7, then stained at PD50 for E7 (blue) and PML (red) (middle-left panel) or 53BP1 (red) and PML (green) (middle-right panel). HCA2 cells were infected at PD40 with a lentivirus expressing SV40LT, then stained at PD55 for SV40LT (blue) and PML (red) (lower-left panel) or for 53BP1 (red) and PML (green) (lower-right panel). (B) Early-passage primary human fibroblasts deficient for ATM, ATR, NBS1, BLM or Artemis were irradiated with 8 Gy. At the indicated intervals thereafter, they were fixed and stained for 53BP1 and PML. Cell populations were scored for the percentage of cells harboring three or more 53BP1 foci, most of which (>75%) colocalized with PML NBs. (C) HCA2 cells at PD25 were infected with retroviruses expressing eGFP (control, left panel), iE1 (middle panel) or PML-RAR (right panel). At PD29, the infected cells were stained for PML. (D) HCA2 cells expressing eGFP, iE1 or PMLRAR (PD30) were irradiated with 0.5 or 10 Gy. At the indicated intervals thereafter, they were stained for 53BP1 foci. Populations were scored for the percentage of cells having three or more 53BP1 foci.
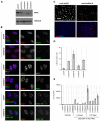
Fig. 5.
Histone H2AX is required for senescence-associated phenotypes. (A) HCA2 cells were infected with lentiviruses expressing short hairpin RNAs directed against eGFP (control, shGFP) or H2AX (shH2AX-A to shH2AX-D). Forty eight hours later, cells were selected for 4 days and allowed to recover for 3 days. Whole-cell lysates were analyzed by western blotting for the indicated proteins. (B) HCA2 cells were infected with lentiviruses expressing shGFP (control) or shH2AX-A–shH2AX-D, as in A. Infected cells were irradiated with 8 Gy. Two days later, they were stained for the indicated DDR proteins. (C) HCA2 cells were infected with lentiviruses expressing shGFP or shH2AX-A–shH2AX-D. Infected cells were irradiated with 10 Gy. 7 days later, BrdU was added for 24 hours. Top panels: cells were fixed and stained for H2AX (grayscale). Lower panels: cells were fixed and stained for DNA synthesis (BrdU incorporation, red) and DNA (DAPI, blue). (D) Cells in A were treated as in B and analyzed for DNA synthesis (BrdU positive). Shown are the means ± s.d. from three or more independent measurements. (E) HCA2 cells were infected as in A and either untreated or irradiated with 10 Gy. After 2 days, conditioned media were collected over an interval of 24 hours from untreated cells (‘Controls’) and irradiated cells 2 days after irradiation (2–3 days) and 9 days after irradiation (9–10 days). Conditioned media were assessed for IL-6 by ELISA. IL-6 secretion is reported as 10–6 pg per cell per day. Shown are the means ± s.d. from three or more independent measurements.
Fig. 6.
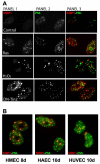
DNA-SCARS are caused by multiple senescence inducers and in several cell types. (A) HCA2 cells were stained for 53BP1 foci (panel 1) and PML NBs (panel 2). Colocalization is shown in yellow (panel 3). Untreated cells were fixed at PD23 (‘Control’), and PD25 cells were infected with a lentivirus encoding either oncogenic Rasv12 (Ras) or a dominant-negative TIN2 protein (DN-Tin2). After a recovery period of 3–4 days, the cells were fixed and stained. Cells were also treated for 1 hour with 100 μM H2O2 (H2O2); 5 days later, they were fixed and stained. (B) Primary HMECs, HUVECs and HAECs were fixed and stained as in A 8 or 10 days, as indicated, after receiving 10 Gy irradiation.
Fig. 7.
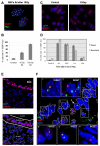
DNA-SCARS are detected in vivo in irradiated mouse tissues. (A) MEFs (early passage) were irradiated with 10 Gy. Eight days later, they were fixed and stained for 53BP1 (red), PML (green) and DAPI (blue). (B) MEFs were irradiated with 10 or 100 Gy. Eight days later, they were stained as in (A) and analyzed for the percentage of cells with three or more 53BP1 foci associated with PML NBs. Shown are the means ± s.d. from three or more independent measurements. (C) Lungs from three-month-old C57BL6 mice were analyzed by immunofluorescence using fresh frozen sections. Representative 53BP1 staining (red) is shown in a control (left panel) animal or an animal irradiated with 8 Gy and analyzed 7 days later (right panel). Nuclei were counterstained with DAPI (blue). (D) Lung alveoli and bronchiolar epithelial cells from control or irradiated animals that were allowed to recover for the indicated periods after 8 Gy irradiation. The percentage of cells with at least one 53BP1 foci was quantified in three independent images from frozen lung sections similar to that displayed in C. Error bars show the s.d. from three independent measurements (total number of nuclei counted; for each time point, _n_=600 or more for lung alveolar cells and _n_=300 or more for bronchiolar epithelial cells). (E) Representative 53BP1 staining (red) of the lung bronchiolar epithelial cells in control mice (nuclei counterstained with DAPI). The lower panel outlines the epithelial cell layer. (F) A lung section from an irradiated animal that was allowed to recover for 7 days after 8 Gy irradiation, stained for 53BP1 (red), PML (green) and DAPI (blue) and analyzed by confocal microscopy. The six cells that displayed 53BP1–PML colocalization are boxed and numbered and magnified in the insets. The thin white lines in the main image outline the periphery of the nuclei.
Similar articles
- The tumor suppressor PML specifically accumulates at RPA/Rad51-containing DNA damage repair foci but is nonessential for DNA damage-induced fibroblast senescence.
Münch S, Weidtkamp-Peters S, Klement K, Grigaravicius P, Monajembashi S, Salomoni P, Pandolfi PP, Weißhart K, Hemmerich P. Münch S, et al. Mol Cell Biol. 2014 May;34(10):1733-46. doi: 10.1128/MCB.01345-13. Epub 2014 Mar 10. Mol Cell Biol. 2014. PMID: 24615016 Free PMC article. - Persistent DNA damage signalling triggers senescence-associated inflammatory cytokine secretion.
Rodier F, Coppé JP, Patil CK, Hoeijmakers WA, Muñoz DP, Raza SR, Freund A, Campeau E, Davalos AR, Campisi J. Rodier F, et al. Nat Cell Biol. 2009 Aug;11(8):973-9. doi: 10.1038/ncb1909. Epub 2009 Jul 13. Nat Cell Biol. 2009. PMID: 19597488 Free PMC article. - Growth of persistent foci of DNA damage checkpoint factors is essential for amplification of G1 checkpoint signaling.
Yamauchi M, Oka Y, Yamamoto M, Niimura K, Uchida M, Kodama S, Watanabe M, Sekine I, Yamashita S, Suzuki K. Yamauchi M, et al. DNA Repair (Amst). 2008 Mar 1;7(3):405-17. doi: 10.1016/j.dnarep.2007.11.011. Epub 2008 Jan 8. DNA Repair (Amst). 2008. PMID: 18248856 - PML links aberrant cytokine signaling and oncogenic stress to cellular senescence.
Bourdeau V, Baudry D, Ferbeyre G. Bourdeau V, et al. Front Biosci (Landmark Ed). 2009 Jan 1;14(2):475-85. doi: 10.2741/3256. Front Biosci (Landmark Ed). 2009. PMID: 19273079 Review. - PML nuclear bodies as sites of epigenetic regulation.
Torok D, Ching RW, Bazett-Jones DP. Torok D, et al. Front Biosci (Landmark Ed). 2009 Jan 1;14(4):1325-36. doi: 10.2741/3311. Front Biosci (Landmark Ed). 2009. PMID: 19273133 Review.
Cited by
- Targeting epiregulin in the treatment-damaged tumor microenvironment restrains therapeutic resistance.
Wang C, Long Q, Fu Q, Xu Q, Fu D, Li Y, Gao L, Guo J, Zhang X, Lam EW, Campisi J, Sun Y. Wang C, et al. Oncogene. 2022 Nov;41(45):4941-4959. doi: 10.1038/s41388-022-02476-7. Epub 2022 Oct 6. Oncogene. 2022. PMID: 36202915 Free PMC article. - Colorimetric detection of senescence-associated β galactosidase.
Itahana K, Itahana Y, Dimri GP. Itahana K, et al. Methods Mol Biol. 2013;965:143-56. doi: 10.1007/978-1-62703-239-1_8. Methods Mol Biol. 2013. PMID: 23296655 Free PMC article. - Hyper-mitogenic drive coexists with mitotic incompetence in senescent cells.
Leontieva OV, Lenzo F, Demidenko ZN, Blagosklonny MV. Leontieva OV, et al. Cell Cycle. 2012 Dec 15;11(24):4642-9. doi: 10.4161/cc.22937. Epub 2012 Nov 27. Cell Cycle. 2012. PMID: 23187803 Free PMC article. - Senescence in Human Mesenchymal Stem Cells: Functional Changes and Implications in Stem Cell-Based Therapy.
Turinetto V, Vitale E, Giachino C. Turinetto V, et al. Int J Mol Sci. 2016 Jul 19;17(7):1164. doi: 10.3390/ijms17071164. Int J Mol Sci. 2016. PMID: 27447618 Free PMC article. Review. - A pro-oxidant combination of resveratrol and copper down-regulates multiple biological hallmarks of ageing and neurodegeneration in mice.
Pal K, Raghuram GV, Dsouza J, Shinde S, Jadhav V, Shaikh A, Rane B, Tandel H, Kondhalkar D, Chaudhary S, Mittra I. Pal K, et al. Sci Rep. 2022 Oct 14;12(1):17209. doi: 10.1038/s41598-022-21388-w. Sci Rep. 2022. PMID: 36241685 Free PMC article.
References
- Acosta J. C., O'Loghlen A., Banito A., Guijarro M. V., Augert A., Raguz S., Furnagalli M., DaCosta M., Brown C., Popov N., et al. (2008). Chemokine signaling via the CXCR2 receptor reinforces senescence. Cell 133, 1006-1018 - PubMed
- Al Rashid S. T., Dellaire G., Cuddihy A., Jalali F., Vaid M., Coackley C., Folkard M., Xu Y., Chen B. P., Chen D. J., et al. (2005). Evidence for the direct binding of phosphorylated p53 to sites of DNA breaks in vivo. Cancer Res. 65, 10810-10821 - PubMed
- Appella E., Anderson C. W. (2001). Post-translational modifications and activation of p53 by genotoxic stresses. Eur. J. Biochem. 268, 2764-2772 - PubMed
- Bakkenist C. J., Kastan M. B. (2003). DNA damage activates ATM through intermolecular autophosphorylation and dimer dissociation. Nature 421, 499-506 - PubMed
Publication types
MeSH terms
Substances
Grants and funding
- AG09909/AG/NIA NIH HHS/United States
- AG025708/AG/NIA NIH HHS/United States
- R56 AG009909/AG/NIA NIH HHS/United States
- P01 AG017242/AG/NIA NIH HHS/United States
- P30 AG025708/AG/NIA NIH HHS/United States
- MPO79317/CAPMC/ CIHR/Canada
- AG17242/AG/NIA NIH HHS/United States
- R37 AG009909/AG/NIA NIH HHS/United States
LinkOut - more resources
Full Text Sources
Other Literature Sources
Research Materials
Miscellaneous
