Aberrant mitochondrial fission in neurons induced by protein kinase C{delta} under oxidative stress conditions in vivo - PubMed (original) (raw)
Aberrant mitochondrial fission in neurons induced by protein kinase C{delta} under oxidative stress conditions in vivo
Xin Qi et al. Mol Biol Cell. 2011.
Abstract
Neuronal cell death in a number of neurological disorders is associated with aberrant mitochondrial dynamics and mitochondrial degeneration. However, the triggers for this mitochondrial dysregulation are not known. Here we show excessive mitochondrial fission and mitochondrial structural disarray in brains of hypertensive rats with hypertension-induced brain injury (encephalopathy). We found that activation of protein kinase Cδ (PKCδ) induced aberrant mitochondrial fragmentation and impaired mitochondrial function in cultured SH-SY5Y neuronal cells and in this rat model of hypertension-induced encephalopathy. Immunoprecipitation studies indicate that PKCδ binds Drp1, a major mitochondrial fission protein, and phosphorylates Drp1 at Ser 579, thus increasing mitochondrial fragmentation. Further, we found that Drp1 Ser 579 phosphorylation by PKCδ is associated with Drp1 translocation to the mitochondria under oxidative stress. Importantly, inhibition of PKCδ, using a selective PKCδ peptide inhibitor (δV1-1), reduced mitochondrial fission and fragmentation and conferred neuronal protection in vivo and in culture. Our study suggests that PKCδ activation dysregulates the mitochondrial fission machinery and induces aberrant mitochondrial fission, thus contributing to neurological pathology.
Figures
FIGURE 1:
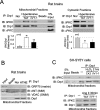
Inhibition of PKCδ reduces excessive mitochondrial fission induced by HTNE. (A) Top: Male Dahl salt-sensitive (DS) rats were fed a high-salt diet (8% NaCl) from 6 to 15 wk of age and treated for 4 wk (beginning at age 11 wk) with either the control cell permeable carrier peptide, TAT47–57, or the PKCδ-inhibitor (δV1-1 coupled to TAT for cell delivery), using subcutaneously implanted osmotic Alzet pumps that deliver 1.0 mg·kg·d. Bottom: Transmission electron microscope (TEM) images of cerebral cortex samples from 13-wk-old control and hypertensive rats with HTNE. Scale bar is 0.2 μm. Arrowhead indicates mitochondria undergoing fission. The arrow indicates fragmented mitochondria. The data are representative EM imaging. Note that either TAT or δV1-1 treatment in control rats has no effect on mitochondrial structure (unpublished data). (B) The percentage of fragmented mitochondria relative to the total number of mitochondria (tubular and fragmented mitochondria) is presented as the mean ± SE of three rats in each group. *p < 0.05. At least 16 fields of cerebral cortex in each rat were analyzed, and more than 500 of mitochondria in each animal were scored and accounted. (C) Mitochondrial and cytosolic fractions of cerebral cortex were subjected to Western blot analysis. The levels of Drp1 and PKCδ in the mitochondrial and cytosolic fractions were determined. VDAC and enolase (markers of mitochondria and cytosol, respectively) were used as internal loading controls. Quantitative data from three rats in each group are provided in the histogram. *p < 0.05 vs. normotensive rats (Nor); #p < 0.05 vs. TAT-treated hypertensive rats. (D) Human SH-SY5Y cells were treated with control peptide TAT or δV1-1-TAT (1 μM each), 15 min before treatment with H2O2 (200 μM) or Ang II (1 μM). The levels of Drp1 and PKCδ in the mitochondrial fractions were determined in three independent experiments. VDAC and Tom20 were used as internal loading control. *p < 0.05 vs. control cells; #p < 0.05 vs. TAT-treated cells.
FIGURE 2:
PKCδ binds to Drp1. Mitochondrial fractions were isolated from the cerebral cortex of hypertensive rats treated with control peptide TAT or with δV1-1. (A) 200 μg of mitochondrial fractions were subjected to immunoprecipitation (IP) with anti-Drp1 antibody, and the immunoprecipitates were analyzed by immunoblotting (IB) with the indicated antibodies. No signals were detected using beads alone. The expressions of Drp1, PKCδ, and PKCε in mitochondrial fractions are shown in the input lane. The input is 10 μg protein of mitochondrial fraction. Quantitative data from five rats in each group are provided in the histogram. Left panel: mitochondrial fractions; right panel: cytosolic fractions. *p < 0.05 and ##p < 0.01 vs. normotensive rats (Nor); **p < 0.01 vs. TAT-treated group. (B) IP with anti-Drp1 antibodies were analyzed by IB with the mitochondrial matrix protein GRP75, mitochondrial inner membrane protein ANT, or the mitochondrial outer membrane protein VDAC. (C) Cultured SH-SY5Y cells were treated with TAT (1 μM) or δV1-1 (1 μM) 15 min before addition of Ang II (1 μM) or H2O2 (200 μM). Mitochondrial fractions isolated from cultured SH-SY5Y neurons were subjected to IP with anti-Drp1 antibody followed by IB with the indicated antibodies. The representative data are from three independent experiments.
FIGURE 3:
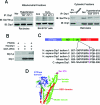
PKCδ phosphorylated Drp1 at Ser 579. (A) The mitochondrial and cytosolic fractions were isolated from the cortex of hypertensive rats and cultured neurons treated with H2O2 (200 μM, 2 h). Then 200 μg of proteins was subjected to immunoprecipitation (IP) with anti-Drp1 antibody, and the immunoprecipitates were analyzed by immunoblotting (IB) with a mixture of serine and threonine antibodies. The input is 10 μg protein. (B) In vitro phosphorylation assays were carried out with recombinant protein GST-PKCδ and His-Drp1 in the presence or absence of the PKC activators phosphatidylserine and diacylglycerol (PS/DG). Shown are representative data from three independent experiments. (C) Mass spectroscopy analysis was carried out after in vitro phosphorylation using recombinant proteins GST-PKCδ and GST-Drp1 in the presence or absence of PKC activators. The site phosphorylated by PKCδ in Drp1 was identified and highlighted in purple among species (see mass spectrometry analysis in Supplementary Figure 4). (D) Modeling of predicted human Drp1 structure (isoform 3). Blue: GTPase domain; green: middle domain and variable domain; red: GTPase effector domain (GED). The phosphorylation site (Ser 579) of Drp1 by PKCδ is highlighted in pink.
FIGURE 4:
Drp1 Ser 579 phosphorylation by PKCδ is associated with Drp1 translocation to the mitochondria in vivo. Drp1 Ser 579 phosphorylation at the mitochondria was determined by using a Drp1 phosphospecific antibody (anti-Drp1 phospho-S616) in the animal model of HTNE (A) and in the cultured SH-SY5Y cells exposed to H2O2 (200 μM for 2 h) (B). VDAC was used as a loading control. The representative data are from two to four independent experiments. (C) SH-SY5Y cells were transfected with control (Con siRNA) and Drp1 siRNA for 48 h. Cells were then transfected with the plasmids of wild-type Drp1 (Drp1wt) or mutant Drp1 at Ser 579 (Drp1S579A) for 24 h. Left panel: Total protein levels of Drp1 were determined by Western blot using Drp1 antibody. GAPDH was used as loading control. The representative data are from two independent experiments. Right panel: The cells were treated with H2O2 (200 μM for 2 h), and the mitochondrial fractions were analyzed by Western blot with the indicated antibodies. The representative data are from two independent experiments.
FIGURE 5:
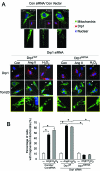
Drp1 Ser 579 phosphorylation promotes fission activity. SH-SY5Y cells were transfected with control (Con siRNA) and Drp1 siRNA for 48 h. Cells were then transfected with the plasmids of control, wild-type Drp1 (Drp1wt), or mutant Drp1 at Ser 579 (Drp1S579A) for 24 h. (A) Top: Control and cells treated with H2O2 (200 μM) or Ang II (1 μM) for 6 h after cells were transfected with control siRNA followed by control vector. The cells were stained with antibodies of Tom20 (green), a mitochondrial marker, and Drp1 (red) and Hoechst nuclear stain (blue). Bottom: Drp1 knockdown was confirmed by staining with anti-Drp1 antibody (top). Tom20 and nuclei were stained as in the left panel. The cells in which endogenous Drp1 was replaced with wild-type (Drp1wt) or Ser 579 mutant (Drp1S579A) are outlined with a dashed line. Arrow shows the cells transfected by only Drp1 siRNA. Scale bar is 0.5 μm. Enlarged mitochondrial network is shown in the yellow box, underneath each panel. (B) Histogram: The percentage of cells with fragmented mitochondria relative to the total number of cells is presented as the mean ± SE of three independent experiments. At least 200 cells per group were counted. *p < 0.05.
FIGURE 6:
PKCδ and Drp1 are interdependent. Human neuroblastoma SH-SY5Y cells were transfected with control siRNA, PKCδ siRNA, or Drp1 siRNA. After 48 h, cells were treated with Ang II (1 μM) for 30 min. (A) Total cell lysates were analyzed by Western blot to confirm knockdown of PKCδ (top) and Drp1 (middle panel). GAPDH was used as an internal loading control. (B) The levels of PKCδ and Drp1 in the mitochondrial fractions were analyzed by Western blot at the indicated groups. (C) Histograms depicting the amount of Drp1 (left) and PKCδ (right) associated with the mitochondria of SH-SY5Y cells. The data are expressed as mean ± SE of three independent experiments. *p < 0.05, **p < 0.01 vs. control group; #p < 0.05, ##p < 0.01 vs. Ang II-treated group.
FIGURE 7:
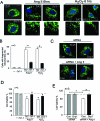
PKCδ and Drp1 complex is associated with increased mitochondrial fragmentation and neuronal cell death. (A) SH-SY5Y neuronal cells were treated with δV1-1 (1 μM) or control peptide TAT (1 μM) 15 min before addition of Ang II (1 μM for 6 h; middle panel) or H2O2 (200 μM for 6 h; right panel). The cells were then stained with MitoTracker Green (100 nM) for 30 min and Hoechst stain (scale bar 0.5 μm). Note that control peptide TAT has no effect on mitochondrial morphology under normal conditions (unpublished data). (B) Histogram: The percentage of cells with fragmented mitochondria relative to the total number of cells is presented as the mean ± SE of three independent experiments. At least 200 cells per group were counted. **p < 0.01. (C) SH-SY5Y cells were transfected with control siRNA and Drp1 siRNA. After 48 h, the cells were incubated with Ang II for 6 h and then stained with MitoTracker Green (100 nM; 30 min) and with Hoechst stain (scale bar 0.5 μm). Cell viability was measure by MTT assay. (D) SH-SY5Y cells were treated with TAT or δV1-1 15 min before treatment with Ang II (2 d) or H2O2 (1 d). *p < 0.05 vs. control; #p < 0.05 vs. TAT-treated cells. The data are presented as the mean ± SE of three independent experiments. (E) SH-SY5Y cells were treated with Ang II for 2 d following treatment with Drp1 siRNA or with control siRNA. *#p < 0.05. The data are presented as mean ± SE (three independent experiments).
FIGURE 8:
Summary scheme. Under control conditions, inactive PKCδ (green) is bound to Drp1, a component of the mitochondrial fission machinery in the cytosol (left). Hypertension (HT) and oxidative stress (OS) lead to PKCδ activation (brown) that causes Drp1 phosphorylation and translocation of the Drp1/PKCδ complex to the outer mitochondrial membrane (OMM), where Drp1 binds to Fis1, a second component of the mitochondrial fission machinery. Under these conditions, Drp1 is phosphorylated by PKCδ, leading to the beginning of mitochondrial fission and fragmentation. All of these effects are inhibited by the PKCδ-selective inhibitor, δV1-1 (middle panel), which prevents this cascade of events by preventing the translocation of the PKCδ/Drp1 complex to the mitochondrial OMM.
Similar articles
- YiQiFuMai Powder Injection Protects against Ischemic Stroke via Inhibiting Neuronal Apoptosis and PKC_δ_/Drp1-Mediated Excessive Mitochondrial Fission.
Xu Y, Wang Y, Wang G, Ye X, Zhang J, Cao G, Zhao Y, Gao Z, Zhang Y, Yu B, Kou J. Xu Y, et al. Oxid Med Cell Longev. 2017;2017:1832093. doi: 10.1155/2017/1832093. Epub 2017 Dec 24. Oxid Med Cell Longev. 2017. PMID: 29435096 Free PMC article. - Protein Kinase C-δ Mediates Kidney Tubular Injury in Cold Storage-Associated Kidney Transplantation.
Zhu J, Zhang G, Song Z, Xiang X, Shu S, Liu Z, Yang D, Wei Q, Dong Z. Zhu J, et al. J Am Soc Nephrol. 2020 May;31(5):1050-1065. doi: 10.1681/ASN.2019101060. Epub 2020 Apr 14. J Am Soc Nephrol. 2020. PMID: 32291286 Free PMC article. - Cdk1, PKCδ and calcineurin-mediated Drp1 pathway contributes to mitochondrial fission-induced cardiomyocyte death.
Zaja I, Bai X, Liu Y, Kikuchi C, Dosenovic S, Yan Y, Canfield SG, Bosnjak ZJ. Zaja I, et al. Biochem Biophys Res Commun. 2014 Oct 31;453(4):710-21. doi: 10.1016/j.bbrc.2014.09.144. Epub 2014 Oct 14. Biochem Biophys Res Commun. 2014. PMID: 25445585 Free PMC article. - AKAP1 Protects from Cerebral Ischemic Stroke by Inhibiting Drp1-Dependent Mitochondrial Fission.
Flippo KH, Gnanasekaran A, Perkins GA, Ajmal A, Merrill RA, Dickey AS, Taylor SS, McKnight GS, Chauhan AK, Usachev YM, Strack S. Flippo KH, et al. J Neurosci. 2018 Sep 19;38(38):8233-8242. doi: 10.1523/JNEUROSCI.0649-18.2018. Epub 2018 Aug 9. J Neurosci. 2018. PMID: 30093535 Free PMC article. - Dynamin-related protein 1: A protein critical for mitochondrial fission, mitophagy, and neuronal death in Parkinson's disease.
Feng ST, Wang ZZ, Yuan YH, Wang XL, Sun HM, Chen NH, Zhang Y. Feng ST, et al. Pharmacol Res. 2020 Jan;151:104553. doi: 10.1016/j.phrs.2019.104553. Epub 2019 Nov 21. Pharmacol Res. 2020. PMID: 31760107 Review.
Cited by
- Mitochondrial dynamics in diabetic cardiomyopathy.
Galloway CA, Yoon Y. Galloway CA, et al. Antioxid Redox Signal. 2015 Jun 10;22(17):1545-62. doi: 10.1089/ars.2015.6293. Epub 2015 Apr 13. Antioxid Redox Signal. 2015. PMID: 25738230 Free PMC article. Review. - PKCδ is an activator of neuronal mitochondrial metabolism that mediates the spacing effect on memory consolidation.
Comyn T, Preat T, Pavlowsky A, Plaçais PY. Comyn T, et al. bioRxiv [Preprint]. 2024 Jun 18:2023.10.06.561186. doi: 10.1101/2023.10.06.561186. bioRxiv. 2024. PMID: 38948698 Free PMC article. Updated. Preprint. - Mitochondrial dynamics and viral infections: A close nexus.
Khan M, Syed GH, Kim SJ, Siddiqui A. Khan M, et al. Biochim Biophys Acta. 2015 Oct;1853(10 Pt B):2822-33. doi: 10.1016/j.bbamcr.2014.12.040. Epub 2015 Jan 13. Biochim Biophys Acta. 2015. PMID: 25595529 Free PMC article. Review. - Increased Drp1 Acetylation by Lipid Overload Induces Cardiomyocyte Death and Heart Dysfunction.
Hu Q, Zhang H, Gutiérrez Cortés N, Wu D, Wang P, Zhang J, Mattison JA, Smith E, Bettcher LF, Wang M, Lakatta EG, Sheu SS, Wang W. Hu Q, et al. Circ Res. 2020 Feb 14;126(4):456-470. doi: 10.1161/CIRCRESAHA.119.315252. Epub 2020 Jan 3. Circ Res. 2020. PMID: 31896304 Free PMC article. - Mutations in Fis1 disrupt orderly disposal of defective mitochondria.
Shen Q, Yamano K, Head BP, Kawajiri S, Cheung JT, Wang C, Cho JH, Hattori N, Youle RJ, van der Bliek AM. Shen Q, et al. Mol Biol Cell. 2014 Jan;25(1):145-59. doi: 10.1091/mbc.E13-09-0525. Epub 2013 Nov 6. Mol Biol Cell. 2014. PMID: 24196833 Free PMC article.
References
- Chan DC. Mitochondrial fusion and fission in mammals. Annu Rev Cell Dev Biol. 2006;22:79–99. - PubMed
- Chen H, Chan DC. Emerging functions of mammalian mitochondrial fusion and fission. Human Mole Genet. 2005;14((spec no. 2)):R283–289. - PubMed
Publication types
MeSH terms
Substances
LinkOut - more resources
Full Text Sources
Other Literature Sources
Molecular Biology Databases
Miscellaneous


