Response characteristics of basolateral and centromedial neurons in the primate amygdala - PubMed (original) (raw)
Comparative Study
Response characteristics of basolateral and centromedial neurons in the primate amygdala
Clayton P Mosher et al. J Neurosci. 2010.
Abstract
Based on cellular architecture and connectivity, the main nuclei of the primate amygdala are divided in two clusters: basolateral (BL) and centromedial (CM). These anatomical features suggest a functional division of labor among the nuclei. The BL nuclei are thought to be involved primarily in evaluating the emotional significance or context-dependent relevance of all stimuli, including social signals such as facial expressions. The CM nuclei appear to be involved in allocating attention to stimuli of high significance and in initiating situation-appropriate autonomic responses. The goal of this study was to determine how this division of labor manifests in the response properties of neurons recorded from these two nuclear groups. We recorded the activity of 454 single neurons from identified nuclear sites in three monkeys trained to perform an image-viewing task. The task required orienting and attending to cues that predicted trial progression and viewing images with broadly varying emotional content. The two populations of neurons showed large overlaps in neurophysiological properties. We found, however, that CM neurons show higher firing and less regular spiking patterns than BL neurons. Furthermore, neurons in the CM nuclei were more likely to respond to task events (fixation, image on, image off), whereas neurons in the BL nuclei were more likely to respond selectively to the content of stimulus images. The overlap in the physiological properties of the CM and BL neurons suggest distributed processing across the nuclear groups. The differences, therefore, appear to be a processing bias rather than a hallmark of mutually exclusive functions.
Figures
Figure 1.
Localization of recording sites in the amygdala. A, Postmortem structural MRI scan of the brain of monkey H shows the electrode tracks aimed at the center of the amygdala. B, In vivo MRI scan of monkey T with an array of seven Thomas electrodes placed into the amygdala.
Figure 2.
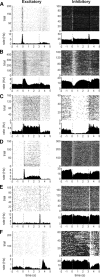
Classification of neural response types observed in the amygdala during an image-viewing task. Each row contains two example neurons that show an excitatory (left) and inhibitory (right) response to the same task event. For each neuron, the rasters (top) and PSTHs (bottom) are aligned to the display and removal of the stimulus image (indicated by dotted lines at 0 and 3 s). Image display was preceded by a 100 ms fixation period. Reward was delivered immediately after image offset. A, Fix-spot responses. Both neurons in this row show a phasic change in firing rate immediately following fix-spot display. The fix-spot neurons in the left and right panels were recorded from the central and medial nuclei, respectively. B, Image-on responses. Both neurons show a phasic change of firing rate following image display and return to baseline firing within 1 s after image display. These neurons were recorded from the accessory basal (left) and central (right) nuclei. C, Tonic image-related responses. The increase and decrease of firing rate in both neurons lasted for the entire duration of image presentation. These neurons were recorded from the accessory basal (left) and central (right) nuclei. D, Phasic–tonic image-related responses. These neurons showed an initial phasic change of firing rate followed by a tonic change of firing rate in the same direction (excitatory or inhibitory) but of smaller amplitude. Typically these neurons were highly selective. Both phasic–tonic image-responsive neurons shown here were recorded from the basal nucleus. E, End-trial/image-off responses. A phasic change of firing rate in these neurons occurred 110–150 ms after the stimulus image was removed from the monitor. These neurons were recorded from the central (left) and accessory basal (right) nuclei. F, End-trial/reward responses. Compared to the image-off responses, the change of firing rate in these neurons occurred later (∼200 ms) and lasted longer, extending 1 s into the 3 s intertrial interval and overlapping in time with the delivery of reward. The excitatory (left) and inhibitory (right) end-trial/reward related responses were recorded from neurons in the central and medial nuclei respectively. As shown here, the majority of neurons respond to more than one task event; e.g., the inhibitory fix-spot response (A, right) is combined with an excitatory image-off response; the phasic inhibitory end-trial response (E, right) is preceded by the phasic inhibitory image-on response.
Figure 3.
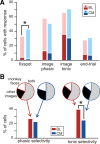
Summary of response properties of the population of neurons recorded from the CM and BL nuclei. A, Relative proportion of neurons with task-related (fix-spot and end-trial) and image-related responses (image phasic and image tonic) in the CM (blue) and BL (red) groups of nuclei. Neurons with inhibitory responses are shown in a more saturated hue of color. Note that the two nuclear groups contained similar proportions of image-related neurons; however, the CM contained a significantly higher proportion of fix-spot-related neurons. The majority of fix-spot neurons were excitatory. B, Relative proportion of stimulus-selective neurons in the CM (blue) and BL (red) nuclear groups. Neurons that showed selective responses in the early period of the response (phasic selectivity) were equally distributed in the CM and BL nuclei; neurons that responded selectively to images in the tonic phase of the response were significantly more numerous in the BL nuclei. The pie charts above each column represent the proportion of neurons from each category that responded selectively to monkey faces (white), to other images (black), or to both monkey faces and other images (gray). Note that the majority of cells in both nuclear groups responded to monkey faces and to other images, indicating that neurons in the amygdala are most likely to respond to multiple types of images. The least likely class of neurons in both nuclear groups are those that respond exclusively to monkey faces. *p < 0.05.
Figure 4.
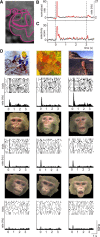
Example of a fix-spot-related, nonselective neuron recorded from the CM nuclei. A, MRI-based reconstruction of the recording site at the center of the central nucleus. B, Normalized _(_z-score) firing rate calculated for all trials (0 s, image on; 3 s, image off). The red segments indicate the time points where the firing rate was significantly (p < 0.01) different from the baseline firing rate (bin size, 1 ms). Note that before image onset (0 s), the neuron showed significant increases of firing rate relative to baseline (fix-spot response), whereas after image display the firing rate was significantly reduced for the entire duration of image display (tonic inhibitory response). C, Normalized selectivity score (H ratio) during the trial. The red segments indicate the times when the firing pattern showed significant (p < 0.01) image selectivity. D, Rasters and PSTHs aligned to the time of image display (0 s). The stimuli were two nonface images and 3 facial expressions from two monkeys. Each monkey is displaying appeasing (left), neutral (middle), and aggressive (right) facial expressions.
Figure 5.
Image-selective, phasic responses recorded from a neuron in the central nucleus of the amygdala. A, MRI-based reconstruction of the recording site. B, Normalized (_z_-score) firing rate calculated for all trials (0 s, image on; 3 s, image off). The red segments indicate the time points where the firing rate was significantly (p < 0.01) different from the baseline firing rate (bin size, 1 ms). Note that in the earliest component of the phasic response, the firing rate was elevated compared to baseline. After this excitatory response, the firing rate showed a significant decrease and returned to baseline within 700 ms. C, Normalized selectivity score (H ratio) during the trial. The red segments indicate the times when the firing pattern showed significant (p < 0.01) image selectivity. D, Neural responses to the individual images in the stimulus set, that included two nonface and six face stimuli. The faces in the top row depict the same monkey with three facial expressions: appeasing (left), neutral (middle), and threatening (right). The faces in the bottom row depict a different monkey with the same three facial expressions. Neural responses to each image are shown as rasters and PSTHs below each image. This neuron responded with a phasic inhibitory response to nonface images and with a phasic excitatory response to face images.
Figure 6.
Example of selective, phasic–tonic responses of a neuron recorded from the basal nucleus of the amygdala. A, MRI-based reconstruction of the recording site. B, Normalized (_z_-score) firing rate of the neuron, indicating in red the bins where the firing rate was significantly (p < 0.01) different from the baseline firing rate (0 s, image on; 3 s, image off). C, Selectivity score during image presentation. The red segments indicate the times when the firing pattern showed significant (p < 0.01) image selectivity. D, Neural responses to images in a stimulus set that contained three nonface images (top row) and six face images. The middle row contains three images of the same monkey displaying appeasing (left), neutral (middle), and threatening (right) facial expressions. The bottom row contains the same type of facial expressions displayed by a different monkey. Neural responses to each image are shown as rasters and the corresponding PSTHs below each image. This neuron responded with a phasic and tonic elevation of firing rate to the nonface images, but with only a phasic response to the face images.
Figure 7.
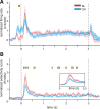
Population averages of firing rate changes and stimulus selectivity over time in the CM and BL nuclear groups. A, Population mean ± SEM of firing rate changes (expressed as _z_-scores) in the CM (blue) and BL (red) nuclei computed for 4.5 s that include the fixation period (0.75 ms before 0) followed by image presentation (from 0 to 3 s) and the end-trial period (0.75 s after the 3 s marking image off). Bin size was 1 ms convolved with a 100 ms Gaussian. Significant differences (p < 0.01) between the population averages in adjacent bins are indicated by the yellow marks. Note that the population of CM neurons shows a larger increase of firing rate in the fixation period than the BL population. This is because of a large fraction of fix-spot-responsive neurons in the CM nuclei. B, Average image selectivity (mean H ratio) of the CM and BL populations computed for a 4 s period centered on image presentation (0 to 3 s). Same bin size as in A is used. The average selectivity is higher in the BL population for several clusters of successive bins that span both the phasic (80–300 ms from image presentation) and tonic (500–3000 ms) periods of the image presentation. The inset is an expansion of the 0 to 500 ms period after image presentation.
Similar articles
- Multisensory Neurons in the Primate Amygdala.
Morrow J, Mosher C, Gothard K. Morrow J, et al. J Neurosci. 2019 May 8;39(19):3663-3675. doi: 10.1523/JNEUROSCI.2903-18.2019. Epub 2019 Mar 11. J Neurosci. 2019. PMID: 30858163 Free PMC article. - Task-dependent spatial selectivity in the primate amygdala.
Peck EL, Peck CJ, Salzman CD. Peck EL, et al. J Neurosci. 2014 Dec 3;34(49):16220-33. doi: 10.1523/JNEUROSCI.3217-14.2014. J Neurosci. 2014. PMID: 25471563 Free PMC article. - Categorical representation of objects in the central nucleus of the monkey amygdala.
Kuraoka K, Nakamura K. Kuraoka K, et al. Eur J Neurosci. 2012 May;35(9):1504-12. doi: 10.1111/j.1460-9568.2012.08061.x. Epub 2012 Apr 16. Eur J Neurosci. 2012. PMID: 22507547 - Fixations Gate Species-Specific Responses to Free Viewing of Faces in the Human and Macaque Amygdala.
Minxha J, Mosher C, Morrow JK, Mamelak AN, Adolphs R, Gothard KM, Rutishauser U. Minxha J, et al. Cell Rep. 2017 Jan 24;18(4):878-891. doi: 10.1016/j.celrep.2016.12.083. Cell Rep. 2017. PMID: 28122239 Free PMC article. - The primate amygdala combines information about space and value.
Peck CJ, Lau B, Salzman CD. Peck CJ, et al. Nat Neurosci. 2013 Mar;16(3):340-8. doi: 10.1038/nn.3328. Epub 2013 Feb 3. Nat Neurosci. 2013. PMID: 23377126 Free PMC article.
Cited by
- Functional circuits and anatomical distribution of response properties in the primate amygdala.
Zhang W, Schneider DM, Belova MA, Morrison SE, Paton JJ, Salzman CD. Zhang W, et al. J Neurosci. 2013 Jan 9;33(2):722-33. doi: 10.1523/JNEUROSCI.2970-12.2013. J Neurosci. 2013. PMID: 23303950 Free PMC article. - The role of the basolateral amygdala in the perception of faces in natural contexts.
Hortensius R, Terburg D, Morgan B, Stein DJ, van Honk J, de Gelder B. Hortensius R, et al. Philos Trans R Soc Lond B Biol Sci. 2016 May 5;371(1693):20150376. doi: 10.1098/rstb.2015.0376. Philos Trans R Soc Lond B Biol Sci. 2016. PMID: 27069053 Free PMC article. - Subcortical shape alterations in major depressive disorder: Findings from the ENIGMA major depressive disorder working group.
Ho TC, Gutman B, Pozzi E, Grabe HJ, Hosten N, Wittfeld K, Völzke H, Baune B, Dannlowski U, Förster K, Grotegerd D, Redlich R, Jansen A, Kircher T, Krug A, Meinert S, Nenadic I, Opel N, Dinga R, Veltman DJ, Schnell K, Veer I, Walter H, Gotlib IH, Sacchet MD, Aleman A, Groenewold NA, Stein DJ, Li M, Walter M, Ching CRK, Jahanshad N, Ragothaman A, Isaev D, Zavaliangos-Petropulu A, Thompson PM, Sämann PG, Schmaal L. Ho TC, et al. Hum Brain Mapp. 2022 Jan;43(1):341-351. doi: 10.1002/hbm.24988. Epub 2020 Mar 21. Hum Brain Mapp. 2022. PMID: 32198905 Free PMC article. - The Basolateral Amygdalae and Frontotemporal Network Functions for Threat Perception.
Hortensius R, Terburg D, Morgan B, Stein DJ, van Honk J, de Gelder B. Hortensius R, et al. eNeuro. 2017 Mar 27;4(1):ENEURO.0314-16.2016. doi: 10.1523/ENEURO.0314-16.2016. eCollection 2017 Jan-Feb. eNeuro. 2017. PMID: 28374005 Free PMC article. - Bidirectional and parallel relationships in macaque face circuit revealed by fMRI and causal pharmacological inactivation.
Liu N, Behrmann M, Turchi JN, Avidan G, Hadj-Bouziane F, Ungerleider LG. Liu N, et al. Nat Commun. 2022 Nov 9;13(1):6787. doi: 10.1038/s41467-022-34451-x. Nat Commun. 2022. PMID: 36351907 Free PMC article.
References
- Adolphs R, Gosselin F, Buchanan TW, Tranel D, Schyns P, Damasio AR. A mechanism for impaired fear recognition after amygdala damage. Nature. 2005;433:68–72. - PubMed
- Amaral DG, Price JL. Amygdalo-cortical projections in the monkey (Macaca fascicularis) J Comp Neurol. 1984;230:465–496. - PubMed
- Amaral DG, Price JL, Pitkanen A, Carmichael ST. Anatomical organization of the primate amygdaloid complex. In: Aggleton JP, editor. The amygdala: neurobiological aspects of emotion, memory, and mental dysfunction. New York: Wiley; 1992. pp. 1–66.
Publication types
MeSH terms
Grants and funding
- R01 MH070836/MH/NIMH NIH HHS/United States
- MH 070836/MH/NIMH NIH HHS/United States
- 52005889/HHMI/Howard Hughes Medical Institute/United States
- R01 MH070836-05/MH/NIMH NIH HHS/United States
- R01 MH070836-05S1/MH/NIMH NIH HHS/United States
LinkOut - more resources
Full Text Sources


