Visual experience induces long-term potentiation in the primary visual cortex - PubMed (original) (raw)
Comparative Study
Visual experience induces long-term potentiation in the primary visual cortex
Sam F Cooke et al. J Neurosci. 2010.
Erratum in
- J Neurosci. 2011 Aug 17;31(33):12058
Abstract
Stimulus-specific response potentiation (SRP) is a robust form of experience-dependent plasticity that occurs in primary visual cortex. In awake mice, visual evoked potentials (VEPs) recorded in layer 4 of binocular visual cortex undergo increases in amplitude with repeated presentation of a sinusoidal grating stimulus over days. This effect is highly specific to the experienced stimulus. Here, we test whether the mechanisms of thalamocortical long-term potentiation (LTP), induced with a theta burst electrical stimulation (TBS) of the dorsal lateral geniculate nucleus, are sufficient to account for SRP. First, we demonstrate that LTP similarly enhances the amplitude of VEPs, but in a way that generalizes across multiple stimuli, spatial frequencies, and contrasts. Second, we show that LTP occludes the subsequent expression of SRP. Third, we reveal that previous SRP occludes TBS-induced LTP of the VEP evoked by the experienced stimulus, but not by unfamiliar stimuli. Finally, we show that SRP is rapidly and selectively reversed by local cortical infusion of a peptide that inhibits PKMζ, a constitutively active kinase known to maintain NMDA receptor-dependent LTP and memory. Thus, SRP is expressed by the same core mechanisms as LTP. SRP therefore provides a simple assay to assess the integrity of LTP in the intact nervous system. Moreover, the results suggest that LTP of visual cortex, like SRP, can potentially be exploited to improve vision.
Figures
Figure 1.
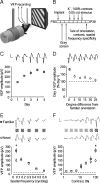
SRP. A, Schematic of experimental apparatus. VEPs were recorded from layer 4 of binocular primary visual cortex (V1). B, Time course of experiments described within Figure 1. Mice were implanted with recording electrodes and head post was affixed at P30. On recovery, mice were habituated to the apparatus on 2 consecutive days. Over the next 5 d, VEPs were sampled, each driven by a 0.5 Hz phase-reversing, full-field, 0.05 cycle/°, 100% contrast, sinusoidal grating stimulus, of _X_° orientation, and averaged each day (gray squares). On the final day, VEPs were evoked by a multitude of other stimuli, varying in spatial frequency, contrast, and orientation (D, white circles). C, The averaged trough–peak VEP amplitude driven by _X_° increased significantly over days, reaching asymptote on day 5 (n = 7). D, VEPs driven by novel stimuli equivalent in all regards except being as little as 5° different in orientation from familiar _X_° (white circles), were significantly lower amplitude than those driven by _X_°. VEP amplitude is here presented as a percentage of those driven by an orthogonal orientation (X + 90°, dotted horizontal line at 100%). VEPs driven by orientations similar to _X_° were greater amplitude than X + 90°-driven VEPs out to a boundary of around X ± 25° (n = 7). E, Averaged VEPs driven by stimuli varying in spatial frequency, from 0.15 to 0.6 cycle/°, were equivalent in amplitude for either the familiar _X_° (gray squares) or unfamiliar X + 90° stimulus (white circles) on day 5. Only at the familiar spatial frequency of 0.05 cycle/° did _X_° evoke a significantly larger VEP than X + 90° (n = 8). F, Averaged VEPs driven on day 5 by stimuli varying in contrast are equivalent in amplitude for either familiar _X_° (gray squares) or unfamiliar X + 90° (white circles) for all contrast values other than the familiar 100% contrast, at which _X_° evoked significantly greater amplitude VEPs than X + 90°. Error bars in all graphs are SEM. Example VEPs are presented for each day above the relevant graph point for C–F. Calibration: vertical, 100 μV; horizontal, 50 ms. VEP traces represent an average of 200 EEG samples after visual stimulus phase reversal. Traces run from phase reversal onset, such that the average response onset is ∼25 ms and the average peak negativity is ∼50 ms after visual stimulus phase reversal. Asterisks represent statistical comparisons yielding a significant difference (p < 0.05).
Figure 2.
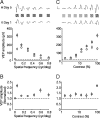
SRP across multiple spatial frequencies and contrasts enhances acuity and contrast sensitivity. A, Awake, head-fixed mice were exposed to full-field, phase-reversing sinusoidal grating stimuli across a range of spatial frequencies (0.05, 0.15, 0.3, 0.45, 0.6, and 0.8 cycle/°) at a set oblique orientation over 5 d. VEP amplitude on day 5 (gray circles) and day 1 (white circles) was compared at each spatial frequency to determine spatial acuity for the two orientations (n = 9). Example VEPs are presented for both orientations in the top of the panel above graph points. Calibration: 100 μV, 50 ms. B, Experience-dependent gains in acuity are revealed by normalizing VEPs on day 5 (gray circles) to day 1. C, Mice were repeatedly exposed to a single oblique orientation across a range of contrast values (0, 1.5, 3.125, 6.25, 12.5, 25, 50, and 100% contrast) for 5 d. VEP amplitude was increased across a range of contrasts on day 5 (gray circles) compared with day 1 (white circles). Example waveforms are presented at the top of the panel. D, Experience-dependent gains in contrast sensitivity are revealed by normalizing VEPs on day 5 (gray circles) to day 1. The dotted lines represent noise levels as determined with a static gray screen in both C and D. Error bars are SEM.
Figure 3.
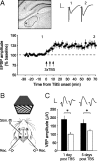
In vivo cortical LTP can be induced using TBS of the dLGN in isoflurane-anesthetized mice. A, Representative example histological section taken from an animal that underwent LTP. The concentric bipolar stimulating electrode tip (asterisk) is placed at the surface of the dLGN (demarcated by a dotted outline). Electrically evoked response amplitude is plotted as a percentage of averaged baseline in the stimulated hemisphere. Stability was determined over a 30 min baseline before induction of saturated LTP by delivering three epochs of TBS (arrows), each separated by 5 min. Field potential amplitude is normalized to the average of the baseline period (n = 20). Each point represents an average of four samples recorded over 2 min. Examples of V1 field potentials evoked 10 min before LTP induction (1) and 50–60 min after the final tetanus (2) are shown at the top of the panel. Calibration: 1 mV, 10 ms. B, Schematic illustrating the experimental setup. One hemisphere received dLGN TBS under light isoflurane general anesthesia. Field potentials were sampled through chronically implanted recording electrodes in layer 4, binocular V1 of this hemisphere. VEPs driven by a sinusoidal grating stimulus were then sampled the following day in both hemispheres (day 1) and also 5 d later using a novel orientation to remove any contribution of SRP. C, VEP amplitude recorded in the two hemispheres at two time points post-TBS. VEPs recorded in the TBS hemisphere (black bar) were greater amplitude (n = 13) than those sampled in the control hemisphere (white bar) on day 1. On day 5, VEPs recorded from the hemisphere receiving TBS were still greater amplitude (n = 13) than in the untetanized hemisphere. Sample VEPs are shown at the top of the panel. Calibration: 100 μV, 50 ms. Error bars are SEM. Asterisks represent statistical comparisons yielding significant difference (p < 0.05).
Figure 4.
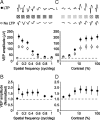
TBS enhances acuity and contrast sensitivity. A, LTP was induced as described previously (Fig. 3). The following day, awake, head-fixed mice were exposed to stimuli across a range of spatial frequencies (0.05, 0.15. 0.3, 0.45, 0.6, 0.8, 1.0 cycle/°) at a set oblique orientation. VEP amplitude was greater across all spatial frequencies in the TBS hemisphere (black circles) than the control hemisphere (white circles; n = 11). Example VEP waveforms are presented from both hemispheres above the relevant graph points. Calibration: 100 μV, 50 ms. B, TBS-induced gains in spatial acuity are revealed by normalizing VEPs in the TBS hemisphere (black circles) to the control hemisphere. C, VEP amplitude was also greater in the TBS hemisphere than the control hemisphere across a range of contrasts (0, 1.5, 3.125, 6.25, 12.5, 25, 50, and 100%). Example waveforms are presented at the top of the panel. D, TBS-induced gains in contrast sensitivity are revealed by normalizing VEPs in the TBS hemisphere to those in the control hemisphere. Error bars in all graphs are SEM.
Figure 5.
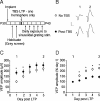
TBS-induced LTP in vivo occludes subsequent experience-dependent plasticity (SRP). A, Experimental time course. P30 mice (n = 13) were implanted with VEP recording electrodes and allowed to habituate to the recording apparatus for 2 d. LTP was induced the next day. One day later, SRP commenced and ran for 5 additional days. B, Examples of VEPs recorded a day after LTP (1) and 5 d later, once SRP was saturated (2), in the TBS hemisphere (black circles) and the control hemisphere (white circles). Calibration: 100 μV, 50 ms. C, VEPs recorded in the TBS hemisphere were greater amplitude than in the control hemisphere on day 1. By day 5, VEPs driven by this same stimulus in the TBS hemisphere and the control hemisphere were of equivalent amplitude. D, VEP amplitudes normalized to day 1 values. On day 5, VEPs were less potentiated by experience of the oriented stimulus in the TBS hemisphere than in the control hemisphere. Error bars are SEMs. Asterisks represent statistical comparisons yielding significant difference (p < 0.05).
Figure 6.
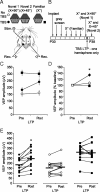
Thalamocortical LTP potentiates VEP amplitude selectively for novel stimuli. A, Experimental schematic. Awake, head-fixed mice were exposed to familiar (_X_°, black squares) and novel (X + 90°, circles) stimuli before and after dLGN TBS in one hemisphere (black symbols). B, Experimental time course. P30 mice (n = 13) were implanted and allowed to habituate to the recording apparatus for 2 d. On day 4, an _X_°-oriented stimulus was presented to the animal. The same stimulus was then presented over the subsequent 4 d. On the last day, a novel X + 90° stimulus was also presented in interleaved fashion. Mice then underwent TBS-induced thalamocortical LTP. The following day, VEPs driven by _X_° and X + 90° were recorded in both hemispheres. C, Before TBS application, VEPs driven by _X_° were greater amplitude in the TBS hemisphere (squares) than those driven by X + 90° in either the TBS (black circles) or control hemisphere (white circles) because of SRP. In the TBS hemisphere after TBS, VEPs driven by a second novel X + 45° stimulus were of close to equivalent magnitude to those driven by _X_°, but significantly greater in amplitude than those in the control hemisphere because of LTP. D, Normalization of VEPs to pre-TBS amplitude reveals that TBS induces significant potentiation of VEPs driven by novel stimuli in the TBS hemisphere but not in the control hemisphere or of VEPs evoked by the familiar _X_° stimulus in the TBS hemisphere. E, Family of lines showing 13 individual animals included in the summary plots displayed in C and D. Error bars are SEMs. Asterisks represent statistical comparisons yielding significant difference (p < 0.05).
Figure 7.
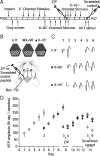
PKMζ is necessary for SRP maintenance. A, Experimental time course. P30 mice (n = 9) were implanted both with recording electrodes and guide cannulae. On recovery, they were habituated to the recording apparatus over 2 d. Mice were then presented with an _X_° stimulus across the following 5 d. This stimulus was not then presented again until the final day of the experiment. On day 5 of _X_° presentation, a novel X + 90° stimulus was also presented and continued to be presented for the remainder. On day 5 of X + 90° stimulus presentation, a second novel X + 45° stimulus was also presented in interleaved fashion. Immediately after X + 90° and X + 45° presentation, a 1 μl injection of the PKMζ-specific inhibitory peptide, ZIP, was administered to the recording area over 10 min. One hour later, VEPs driven by X + 90° and X + 45° stimuli were again sampled. These two stimuli were then presented repeatedly over the following 4 d. On the final day of the experiment, all three stimuli were presented in interleaved fashion. Immediately afterward, a 1 μl injection of scrambled, control peptide was administered to the recording area over 10 min. One hour later, VEPs driven by all three stimuli were again recorded. B, Experimental schematic. Head-fixed, awake animals with chronically implanted recording electrodes and guide cannulae in binocular V1 were presented with _X_° (white circles), X + 90° (gray squares), and X + 45° (black triangles) stimuli and received ZIP or scrambled peptide infusions at various time points over the course of the experiment. C, Example VEP waveforms driven by three orientations at pertinent time points during SRP, SRP erasure by ZIP, SRP reinstatement and after infusion of a control scrambled peptide. Calibration: 100 μV, 50 ms. D, VEPs driven by _X_° (white circles) underwent SRP over the first 5 d of the experiment. On day 5, X + 90° evoked significantly lower amplitude VEPs (gray squares), demonstrating stimulus specificity. By day 9, VEPs evoked by X + 90° had undergone significant SRP, whereas the second novel X + 45° stimulus (black triangles) evoked unpotentiated VEPs. ZIP was then infused proximal to the recording site. One hour later, VEPs driven by X + 90° and X + 45° were of comparable unpotentiated amplitude, demonstrating erasure of SRP by ZIP. Repeated re-presentation of both stimuli then induced equivalent SRP over the following days. On day 13, 1 week after the most recent presentation, _X_° evoked significantly lower amplitude VEPs than either of the other orientations or the _X_° stimulus on day 5 before ZIP. Finally, on day 13, a control peptide was infused proximal to the recording site. One hour after infusion of this peptide, VEPs driven by the _X_°, X + 90°, and X + 45° stimulus maintained comparable values to before the infusion. Error bars are SEMs.
Similar articles
- Long-term potentiation of thalamocortical transmission in the adult visual cortex in vivo.
Heynen AJ, Bear MF. Heynen AJ, et al. J Neurosci. 2001 Dec 15;21(24):9801-13. doi: 10.1523/JNEUROSCI.21-24-09801.2001. J Neurosci. 2001. PMID: 11739588 Free PMC article. - Electrophysiological Signatures of Visual Recognition Memory across All Layers of Mouse V1.
Hayden DJ, Finnie PSB, Thomazeau A, Li AY, Cooke SF, Bear MF. Hayden DJ, et al. J Neurosci. 2023 Nov 1;43(44):7307-7321. doi: 10.1523/JNEUROSCI.0090-23.2023. Epub 2023 Sep 15. J Neurosci. 2023. PMID: 37714707 Free PMC article. - Short-term (2 to 5 h) dark exposure lowers long-term potentiation (LTP) induction threshold in rat primary visual cortex.
Kuo MC, Dringenberg HC. Kuo MC, et al. Brain Res. 2009 Jun 18;1276:58-66. doi: 10.1016/j.brainres.2009.04.042. Epub 2009 May 3. Brain Res. 2009. PMID: 19409376 - How the mechanisms of long-term synaptic potentiation and depression serve experience-dependent plasticity in primary visual cortex.
Cooke SF, Bear MF. Cooke SF, et al. Philos Trans R Soc Lond B Biol Sci. 2013 Dec 2;369(1633):20130284. doi: 10.1098/rstb.2013.0284. Print 2014 Jan 5. Philos Trans R Soc Lond B Biol Sci. 2013. PMID: 24298166 Free PMC article. Review.
Cited by
- Theta Oscillations in Visual Cortex Emerge with Experience to Convey Expected Reward Time and Experienced Reward Rate.
Zold CL, Hussain Shuler MG. Zold CL, et al. J Neurosci. 2015 Jul 1;35(26):9603-14. doi: 10.1523/JNEUROSCI.0296-15.2015. J Neurosci. 2015. PMID: 26134643 Free PMC article. - Repetitive visual stimulation enhances recovery from severe amblyopia.
Montey KL, Eaton NC, Quinlan EM. Montey KL, et al. Learn Mem. 2013 May 16;20(6):311-7. doi: 10.1101/lm.030361.113. Learn Mem. 2013. PMID: 23685763 Free PMC article. - Stimulus-specific plasticity of macaque V1 spike rates and gamma.
Peter A, Stauch BJ, Shapcott K, Kouroupaki K, Schmiedt JT, Klein L, Klon-Lipok J, Dowdall JR, Schölvinck ML, Vinck M, Schmid MC, Fries P. Peter A, et al. Cell Rep. 2021 Dec 7;37(10):110086. doi: 10.1016/j.celrep.2021.110086. Cell Rep. 2021. PMID: 34879273 Free PMC article. - Long-term potentiation and long-term depression: a clinical perspective.
Bliss TV, Cooke SF. Bliss TV, et al. Clinics (Sao Paulo). 2011;66 Suppl 1(Suppl 1):3-17. doi: 10.1590/s1807-59322011001300002. Clinics (Sao Paulo). 2011. PMID: 21779718 Free PMC article. Review. - The development of human visual cortex and clinical implications.
Siu CR, Murphy KM. Siu CR, et al. Eye Brain. 2018 Apr 24;10:25-36. doi: 10.2147/EB.S130893. eCollection 2018. Eye Brain. 2018. PMID: 29760575 Free PMC article. Review.
References
- Abraham WC. Metaplasticity: tuning synapses and networks for plasticity. Nat Rev Neurosci. 2008;9:387. - PubMed
- Artola A, Singer W. Long-term potentiation and NMDA receptors in rat visual cortex. Nature. 1987;330:649–652. - PubMed
- Barth AL, Malenka RC. NMDAR EPSC kinetics do not regulate the critical period for LTP at thalamocortical synapses. Nat Neurosci. 2001;4:235–236. - PubMed
Publication types
MeSH terms
Grants and funding
- R01 EY012309/EY/NEI NIH HHS/United States
- R01 EY018323/EY/NEI NIH HHS/United States
- R01 EY018323-01/EY/NEI NIH HHS/United States
- HHMI/Howard Hughes Medical Institute/United States
LinkOut - more resources
Full Text Sources
Other Literature Sources
