Pandemics in the age of Twitter: content analysis of Tweets during the 2009 H1N1 outbreak - PubMed (original) (raw)
Pandemics in the age of Twitter: content analysis of Tweets during the 2009 H1N1 outbreak
Cynthia Chew et al. PLoS One. 2010.
Abstract
Background: Surveys are popular methods to measure public perceptions in emergencies but can be costly and time consuming. We suggest and evaluate a complementary "infoveillance" approach using Twitter during the 2009 H1N1 pandemic. Our study aimed to: 1) monitor the use of the terms "H1N1" versus "swine flu" over time; 2) conduct a content analysis of "tweets"; and 3) validate Twitter as a real-time content, sentiment, and public attention trend-tracking tool.
Methodology/principal findings: Between May 1 and December 31, 2009, we archived over 2 million Twitter posts containing keywords "swine flu," "swineflu," and/or "H1N1." using Infovigil, an infoveillance system. Tweets using "H1N1" increased from 8.8% to 40.5% (R(2) = .788; p<.001), indicating a gradual adoption of World Health Organization-recommended terminology. 5,395 tweets were randomly selected from 9 days, 4 weeks apart and coded using a tri-axial coding scheme. To track tweet content and to test the feasibility of automated coding, we created database queries for keywords and correlated these results with manual coding. Content analysis indicated resource-related posts were most commonly shared (52.6%). 4.5% of cases were identified as misinformation. News websites were the most popular sources (23.2%), while government and health agencies were linked only 1.5% of the time. 7/10 automated queries correlated with manual coding. Several Twitter activity peaks coincided with major news stories. Our results correlated well with H1N1 incidence data.
Conclusions: This study illustrates the potential of using social media to conduct "infodemiology" studies for public health. 2009 H1N1-related tweets were primarily used to disseminate information from credible sources, but were also a source of opinions and experiences. Tweets can be used for real-time content analysis and knowledge translation research, allowing health authorities to respond to public concerns.
Conflict of interest statement
Competing Interests: The authors have declared that no competing interests exist.
Figures
Figure 1. Tweets containing H1N1, swine flu, or both from May to December 2009.
Lines = absolute number. Bars = relative percentage. Blue = “swine flu” or swineflu. Red = H1N1. Green = (“swine flu” or swineflu) AND H1N1.
Figure 2. Non-linear pattern of tweeted misinformation identified via manual coding from May to December 2009.
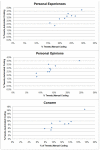
Figure 3. Example scatterplots of manual versus automated coding proportions.
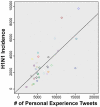
Figure 4. Scatterplot of tweets sharing personal experiences and USA H1N1 incidence rate.
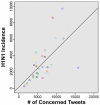
Figure 5. Scatterplot of tweets expressing concern and USA H1N1 incidence rate.
Figure 6. The relative proportion of tweets expressing humour from May 1 to December 31, 2009.
Figure was scaled to the highest peak on July 5 where 9.82% of all tweets expressed misinformation. The peak was assigned a score of 100. A = June 11: WHO pandemic level 6 announcement. 1 = July 5: Harry Potter actor Rupert Grint has H1N1.
Figure 7. The relative proportion of tweets expressing frustration from May 1 to December 31, 2009.
Figure was scaled to the highest peak on May 1 where 4.65% of all tweets expressed frustration. The peak was assigned a score of 100. A = June 11: WHO pandemic level 6 announcement.
Figure 8. The relative proportion of tweets sharing personal experiences from May 1 to December 31, 2009.
Figure was scaled to the highest peak on Oct. 20 where 5.64% of all tweets shared personal experiences. The peak was assigned a score of 100.
Subconcepts:
Red = indirect (family/friend) experience. Yellow = personal/direct experience. Blue = vaccination experience. A = June 11: WHO pandemic level 6 announcement. 1 = Oct 6: H1N1 vacctionations arrive in the US.
Figure 9. The relative proportion of tweets expressing concern from May 1 to December 31, 2009.
Figure was scaled to the highest peak on July 5 where 30.66% of all tweets expressed concern. The peak was assigned a score of 100.
Subconcepts:
Blue = concern for others. Red = concern for self. Yellow = concerned emoticons. Green = general concern. A = June 11: WHO pandemic level 6 announcement. 1 = July 5: Harry Potter actor Rupert Grint has H1N1.
Figure 10. The relative proportion of tweets expressing relief from May 1 to December 31, 2009.
Figure was scaled to the highest peak on Nov. 27 where 1.33% of all tweets expressed relief. The peak was assigned a score of 100. A = June 11: WHO pandemic level 6 announcement. 1 = July 5: Harry Potter actor Rupert Grint has H1N1. 2 = Nov 25–27: #iamthankfulfor campaign.
Figure 11. The relative proportion of tweets expressing misinformation from May 1 to December 31, 2009.
Figure was scaled to the highest peak on Sept. 20 where 1.93% of all tweets expressed misinformation. The peak was assigned a score of 100. A = June 11: WHO pandemic level 6 announcement. 1 = Aug 2: CBS reports on parental concerns about H1N1. 2 = Sept 18–21: Ten swine flu lies told by the mainstream media. 3 = Nov 27: WHO and drug companies in collusion. 4 = Dec 25: Carbon monoxide poisoning can create same symptoms as H1N1.
Figure 12. The relative proportion of tweets expressing downplayed risk from May 1 to December 31, 2009.
Figure was scaled to the highest peak on July 20 where 6.96% of all tweets expressed downplayed risk. The peak was assigned a score of 100. A = June 11: WHO pandemic level 6 announcement. 1 = July 20: Viral dissemination of the “face mask (H1N1) versus condom (AIDS) comparison.” 2 = Dec 1: Viral dissemination of the “face mask (H1N1) versus condom (AIDS) comparison.”
Figure 13. The relative proportion of tweets sharing personal opinions & interest from May 1 to December 31, 2009.
Figure was scaled to the highest peak on Sept. 8 where 5.34% of all tweets shared personal opinions. The peak was assigned a score of 100. A = June 11: WHO pandemic level 6 announcement. 1 = Sept. 8: Case of H1N1 confirmed at PAX videogame convention in Seattle.
Figure 14. The relative proportion of tweets sharing questions from May 1 to December 31, 2009.
Figure was scaled to the highest peak on July 5 where 18.99% of all tweets shared questions. The peak was assigned a score of 100. A = June 11: WHO pandemic level 6 announcement. 1 = July 5: Harry Potter actor Rupert Grint has H1N1. 2 = July 20: Viral dissemination of the “face mask (H1N1) versus condom (AIDS) comparison.” 3 = August 5: Unexplained drop in questions.
Figure 15. The relative proportion of tweets sharing resources from May 1 to December 31, 2009.
Figure was scaled to the highest peak on Dec. 25 where 77.27% of all tweets shared resources. The peak was assigned a score of 100. A = June 11: WHO pandemic level 6 announcement.
Similar articles
- Temporal and Location Variations, and Link Categories for the Dissemination of COVID-19-Related Information on Twitter During the SARS-CoV-2 Outbreak in Europe: Infoveillance Study.
Pobiruchin M, Zowalla R, Wiesner M. Pobiruchin M, et al. J Med Internet Res. 2020 Aug 28;22(8):e19629. doi: 10.2196/19629. J Med Internet Res. 2020. PMID: 32790641 Free PMC article. - The use of Twitter to track levels of disease activity and public concern in the U.S. during the influenza A H1N1 pandemic.
Signorini A, Segre AM, Polgreen PM. Signorini A, et al. PLoS One. 2011 May 4;6(5):e19467. doi: 10.1371/journal.pone.0019467. PLoS One. 2011. PMID: 21573238 Free PMC article. - A case study of the New York City 2012-2013 influenza season with daily geocoded Twitter data from temporal and spatiotemporal perspectives.
Nagar R, Yuan Q, Freifeld CC, Santillana M, Nojima A, Chunara R, Brownstein JS. Nagar R, et al. J Med Internet Res. 2014 Oct 20;16(10):e236. doi: 10.2196/jmir.3416. J Med Internet Res. 2014. PMID: 25331122 Free PMC article. - Topics, Trends, and Sentiments of Tweets About the COVID-19 Pandemic: Temporal Infoveillance Study.
Chandrasekaran R, Mehta V, Valkunde T, Moustakas E. Chandrasekaran R, et al. J Med Internet Res. 2020 Oct 23;22(10):e22624. doi: 10.2196/22624. J Med Internet Res. 2020. PMID: 33006937 Free PMC article. - COVID-19 and the 5G Conspiracy Theory: Social Network Analysis of Twitter Data.
Ahmed W, Vidal-Alaball J, Downing J, López Seguí F. Ahmed W, et al. J Med Internet Res. 2020 May 6;22(5):e19458. doi: 10.2196/19458. J Med Internet Res. 2020. PMID: 32352383 Free PMC article.
Cited by
- Disease detection or public opinion reflection? Content analysis of tweets, other social media, and online newspapers during the measles outbreak in The Netherlands in 2013.
Mollema L, Harmsen IA, Broekhuizen E, Clijnk R, De Melker H, Paulussen T, Kok G, Ruiter R, Das E. Mollema L, et al. J Med Internet Res. 2015 May 26;17(5):e128. doi: 10.2196/jmir.3863. J Med Internet Res. 2015. PMID: 26013683 Free PMC article. - Can Twitter Be a Source of Information on Allergy? Correlation of Pollen Counts with Tweets Reporting Symptoms of Allergic Rhinoconjunctivitis and Names of Antihistamine Drugs.
Gesualdo F, Stilo G, D'Ambrosio A, Carloni E, Pandolfi E, Velardi P, Fiocchi A, Tozzi AE. Gesualdo F, et al. PLoS One. 2015 Jul 21;10(7):e0133706. doi: 10.1371/journal.pone.0133706. eCollection 2015. PLoS One. 2015. PMID: 26197474 Free PMC article. - Uncovering the Complexity of Perinatal Polysubstance Use Disclosure Patterns on X: Mixed Methods Study.
Wu D, Shead H, Ren Y, Raynor P, Tao Y, Villanueva H, Hung P, Li X, Brookshire RG, Eichelberger K, Guille C, Litwin AH, Olatosi B. Wu D, et al. J Med Internet Res. 2024 Sep 20;26:e53171. doi: 10.2196/53171. J Med Internet Res. 2024. PMID: 39302713 Free PMC article. - Sexual and Gender-Diverse Individuals Face More Health Challenges during COVID-19: A Large-Scale Social Media Analysis with Natural Language Processing.
Zhang Z, Hua Y, Zhou P, Lin S, Li M, Zhang Y, Zhou L, Liao Y, Yang J. Zhang Z, et al. Health Data Sci. 2024 Sep 6;4:0127. doi: 10.34133/hds.0127. eCollection 2024. Health Data Sci. 2024. PMID: 39247070 Free PMC article. - The #SeePainMoreClearly Phase II Pain in Dementia Social Media Campaign: Implementation and Evaluation Study.
Castillo LIR, Tran V, Brachaniec M, Chambers CT, Chessie K, Couros A, LeRuyet A, LeRuyet C, Thorpe L, Williams J, Wheelwright S, Hadjistavropoulos T. Castillo LIR, et al. JMIR Aging. 2024 Feb 8;7:e53025. doi: 10.2196/53025. JMIR Aging. 2024. PMID: 38329793 Free PMC article.
References
- Picard A. Lessons of H1N1: Preach less, reveal more. 2010. Globe and Mail. Available: http://www.webcitation.org/5qYZly99e.
- Kasperson R, Renn O, Slovic P, Brown H, Emel J, et al. The social amplification of risk: a conceptual framework. Risk Analysis. 1988;8:177–187.
- Lau J, Griffiths S, Choi K, Tsui H. Widespread public misconception in the early phase of the H1N1 influenza epidemic. Journal of Infection. 2009;59:122–127. - PubMed
Publication types
MeSH terms
LinkOut - more resources
Full Text Sources
Other Literature Sources
Medical


