Amino acids activate mammalian target of rapamycin complex 2 (mTORC2) via PI3K/Akt signaling - PubMed (original) (raw)
Amino acids activate mammalian target of rapamycin complex 2 (mTORC2) via PI3K/Akt signaling
Irantzu Tato et al. J Biol Chem. 2011.
Abstract
The activity of mammalian target of rapamycin (mTOR) complexes regulates essential cellular processes, such as growth, proliferation, or survival. Nutrients such as amino acids are important regulators of mTOR complex 1 (mTORC1) activation, thus affecting cell growth, protein synthesis, and autophagy. Here, we show that amino acids may also activate mTOR complex 2 (mTORC2). This activation is mediated by the activity of class I PI3K and of Akt. Amino acids induced a rapid phosphorylation of Akt at Thr-308 and Ser-473. Whereas both phosphorylations were dependent on the presence of mTOR, only Akt phosphorylation at Ser-473 was dependent on the presence of rictor, a specific component of mTORC2. Kinase assays confirmed mTORC2 activation by amino acids. This signaling was functional, as demonstrated by the phosphorylation of Akt substrate FOXO3a. Interestingly, using different starvation conditions, amino acids can selectively activate mTORC1 or mTORC2. These findings identify a new signaling pathway used by amino acids underscoring the crucial importance of these nutrients in cell metabolism and offering new mechanistic insights.
Figures
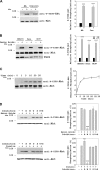
FIGURE 1.
Akt is phosphorylated at Thr-308 in response to amino acids. A–D, HeLa cells were deprived of serum overnight and stimulated with 200 n
m
insulin for 30 min, or after serum withdrawal, they were deprived for 2 h of amino acids (AA) with DPBS medium, followed by stimulation with 1× amino acids for 30 min or the indicated times (C). In B, MCF7 or HEK293 cells were treated with amino acids as in A. Where indicated, the cells were pretreated with 20 n
m
rapamycin (R), 100 n
m
wortmannin (W), 5 μ
m
U0126 (U), or 10 μ
m
SB 203580 (S) for 60 min before insulin or amino acid stimulation. Cellular lysates were analyzed by Western blot with the indicated antibodies. Molecular mass markers are indicated on the left. Quantification and statistical analyses (right panels) were performed as described under “Experimental Procedures.” These data are representative of at least three independent experiments.
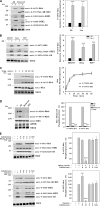
FIGURE 2.
Amino acids induce Akt phosphorylation at Ser-473. HeLa (A–E), MCF7 (B), or HEK293 (B) cells were treated with insulin or amino acids (AA) as in Fig. 1. D, cells deprived of amino acids as in A were stimulated with amino acids (1×), betaine (10 m
m
), or γ-amino-_n_-butyric acid (AIB, 10 m
m
) for 30 min. Where indicated, the cells were pretreated with 20 n
m
rapamycin (R), 100 n
m
wortmannin (W), 5 μ
m
U0126 (U), or 10 μ
m
SB 203580 (S) for 60 min before insulin or amino acid stimulation. Cellular lysates were analyzed by Western blot with the indicated antibodies. *, anti-P-T389-S6K1 antibody recognized phosphorylated RSK or MSK in amino acid-stimulated cells (39). Molecular mass markers are indicated on the left. These data are representative of three independent experiments. Quantification and statistical analyses (right panels) were performed as described under “Experimental Procedures.”
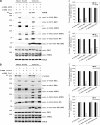
FIGURE 3.
Amino acids induce Akt phosphorylations via class I PI3K. HeLa cells were treated with insulin or amino acids as in Fig. 1. Cells were pretreated with 100 n
m
wortmannin (W), 1 μ
m
class I PI3K isoform-specific inhibitors (α, β, and δ) (panel A), or with 100 m
m
wortmanin (W), 1 μ
m
class I PI3K isoform-specific inhibitor (α), or 10 m
m
hVps34 class III PI3K-specific inhibitor 3-methyladenine (3MA) for 60 min before insulin or amino acid stimulation. Molecular mass markers are indicated on the left. These data are representative of three independent experiments. Quantification and statistical analyses (lower panels) were performed as described under “Experimental Procedures.”
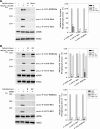
FIGURE 4.
mTOR and rictor are required for the phosphorylation of Akt Ser-473 induced by amino acids. HeLa cells were transfected with either mTOR siRNA (A), rictor siRNA (B), or nontargeting (NT) control siRNA (A and B) 48 h before serum deprivation. Deprivation and stimulation with insulin or amino acids were performed as in Fig. 1. Cellular lysates were analyzed by Western blot with the indicated antibodies. *, phospho-RSK/MSK band (see Fig. 2). Molecular mass markers are indicated on the left. Quantification and statistical analyses (right panels) were performed as described under “Experimental Procedures.” These data are representative of three independent experiments.
FIGURE 5.
Amino acids induce phosphorylation of Akt Ser-473 through mTORC2. HeLa cells were treated as in Fig. 1. Postnuclear supernatants (PNS) were immunoprecipitated (IP) with anti-mTOR (A), anti-raptor (B), or anti-rictor (C) antibodies. Immunocomplexes were resuspended in kinase buffer and incubated with purified FLAG-HA-Akt1 (substrate) in the presence or absence of ATP for 40 min at 37 °C. The reactions were stopped in ice with SDS/PAGE buffer and analyzed by Western blot with the indicated antibodies. Band intensities from three independent experiments were quantified and normalized relative to mTOR (A), raptor (B), or rictor (C). The data represent the ratio of P-S473-FLAG-HA-Akt1 phosphorylation and are expressed as the means ± S.E. of percentage of respective control.
FIGURE 6.
Amino acids inactivate FOXO3a independently of JNK activity. HeLa cells were deprived of serum overnight and stimulated with 50 ng/ml PDGF for 30 min, or after serum withdrawal, they were deprived for 2 h of amino acids (AA) with DPBS medium, followed by stimulation with 1× amino acids for 30 min. Where indicated, the cells were pretreated with 100 n
m
wortmannin (W) and 10 μ
m
Akti-1/2 (panel A), or with 100 n
m
wortmanin (W) and 10 μ
m
SP600125 (SP) for 60 min before amino acid stimulation. Cellular lysates were analyzed by Western blot with the indicated antibodies. Molecular mass markers are indicated on the left. Quantification and statistical analyses (right panels) were performed as described under “Experimental Procedures.” In this figure, the significance (***, p < 0.001) in the statistical analyses is indicated by †. These data are representative of three independent experiments.
FIGURE 7.
Amino acid signaling mechanisms depend on starvation conditions. After serum deprivation, HeLa (A, C, and D) or HEK293 (B) cells were deprived for 2 h of amino acids using either DPBS or DMEM(−AA) medium (DMEM without serum and without amino acids). After this, the cells were stimulated with 1× amino acids for 30 min. Where indicated, the cells were pretreated with 20 n
m
rapamycin (R), 100 n
m
wortmannin (W), or 10 m
m
hVps34 class III PI3K-specific inhibitor 3-methyladenine (3MA) for 60 min before amino acid stimulation. Cellular lysates were analyzed by Western blot with the indicated antibodies. *, phospho-RSK/MSK band (see Fig. 2). Molecular mass markers are indicated on the left. Quantification and statistical analyses (
supplemental Fig. S2
) were performed as described under “Experimental Procedures.” These data are representative of three independent experiments.
FIGURE 8.
mTOR dependence in the signaling by amino acids. HeLa cells were transfected with either mTOR siRNA or nontargeting (NT) control siRNA 48 h before serum deprivation. Starvation and stimulation by amino acids were as in Fig. 7. Cellular lysates were analyzed by Western blot with the indicated antibodies. *, phospho-RSK/MSK band (see Fig. 2). Molecular mass markers are indicated on the left. Quantification and statistical analyses (right panels) were performed as described under “Experimental Procedures.” These data are representative of three independent experiments.
FIGURE 9.
Amino acid signaling depends on DPBS starvation time. HeLa cells were deprived of serum overnight. After serum withdrawal, they were deprived with DPBS medium for the indicated times. Finally the cells were stimulated with 1× amino acids for 30 min. Cellular lysates were analyzed by Western blot with the indicated antibodies. Molecular mass markers are indicated on the left. Quantification and statistical analyses (right panels) were performed as described under “Experimental Procedures.” These data are representative of at least three independent experiments.
FIGURE 10.
Amino acid supplementation leads to activation of mTORC1 and mTORC2. HeLa cells were supplemented with 1× amino acids for 30 min after 48 h in DMEM complete medium. Cellular lysates were analyzed by Western blot with the indicated antibodies. Molecular mass markers are indicated on the left. Quantification and statistical analyses (right panels) were performed as described under “Experimental Procedures.” These data are representative of at least three independent experiments.
FIGURE 11.
A putative model of how amino acids may stimulate cell proliferation and survival pathways. When cells are supplemented with amino acids, kinase activities of mTORC1 (measured as the phosphorylation of their substrates: 4E-BP1 at Thr-37/Thr-46 and S6K1 at Thr-389) and mTORC2 (measured as the phosphorylation of its substrate: Akt at Ser-473) are stimulated. Previous amino acid starvation with DMEM(−AA) or DPBS selects the further activation of mTORC1 or mTORC2 when amino acids are added. Under these conditions, mTORC1 activation is dependent on the class III PI3K (hVps34), and mTORC2 activation is dependent on the α isoform of the class I PI3K. Additionally, Akt Thr-308 phosphorylation is also dependent of the α isoform of the class I PI3K and of the presence of mTOR but independent of mTORC1 and mTORC2 complexes (not shown). Both starvation conditions stimulate autophagy, which can be inhibited either by mTORC1-dependent (71, 72) and mTORC1-independent mechanisms (39). The dashed lines indicate that several steps may be involved. Activation or inhibition is indicated with arrows or blunt-ended arrows, respectively.
Similar articles
- mTORC1-activated S6K1 phosphorylates Rictor on threonine 1135 and regulates mTORC2 signaling.
Julien LA, Carriere A, Moreau J, Roux PP. Julien LA, et al. Mol Cell Biol. 2010 Feb;30(4):908-21. doi: 10.1128/MCB.00601-09. Epub 2009 Dec 7. Mol Cell Biol. 2010. PMID: 19995915 Free PMC article. - PRR5, a novel component of mTOR complex 2, regulates platelet-derived growth factor receptor beta expression and signaling.
Woo SY, Kim DH, Jun CB, Kim YM, Haar EV, Lee SI, Hegg JW, Bandhakavi S, Griffin TJ, Kim DH. Woo SY, et al. J Biol Chem. 2007 Aug 31;282(35):25604-12. doi: 10.1074/jbc.M704343200. Epub 2007 Jun 28. J Biol Chem. 2007. PMID: 17599906 - Rictor phosphorylation on the Thr-1135 site does not require mammalian target of rapamycin complex 2.
Boulbes D, Chen CH, Shaikenov T, Agarwal NK, Peterson TR, Addona TA, Keshishian H, Carr SA, Magnuson MA, Sabatini DM, Sarbassov dos D. Boulbes D, et al. Mol Cancer Res. 2010 Jun;8(6):896-906. doi: 10.1158/1541-7786.MCR-09-0409. Epub 2010 May 25. Mol Cancer Res. 2010. PMID: 20501647 Free PMC article. - Discrete signaling mechanisms of mTORC1 and mTORC2: Connected yet apart in cellular and molecular aspects.
Jhanwar-Uniyal M, Amin AG, Cooper JB, Das K, Schmidt MH, Murali R. Jhanwar-Uniyal M, et al. Adv Biol Regul. 2017 May;64:39-48. doi: 10.1016/j.jbior.2016.12.001. Epub 2017 Jan 4. Adv Biol Regul. 2017. PMID: 28189457 Review. - Diverse signaling mechanisms of mTOR complexes: mTORC1 and mTORC2 in forming a formidable relationship.
Jhanwar-Uniyal M, Wainwright JV, Mohan AL, Tobias ME, Murali R, Gandhi CD, Schmidt MH. Jhanwar-Uniyal M, et al. Adv Biol Regul. 2019 May;72:51-62. doi: 10.1016/j.jbior.2019.03.003. Epub 2019 Apr 11. Adv Biol Regul. 2019. PMID: 31010692 Review.
Cited by
- Akt-dependent activation of the heart 6-phosphofructo-2-kinase/fructose-2,6-bisphosphatase (PFKFB2) isoenzyme by amino acids.
Novellasdemunt L, Tato I, Navarro-Sabate A, Ruiz-Meana M, Méndez-Lucas A, Perales JC, Garcia-Dorado D, Ventura F, Bartrons R, Rosa JL. Novellasdemunt L, et al. J Biol Chem. 2013 Apr 12;288(15):10640-51. doi: 10.1074/jbc.M113.455998. Epub 2013 Mar 2. J Biol Chem. 2013. PMID: 23457334 Free PMC article. - mTORC2 Is Involved in the Induction of RSK Phosphorylation by Serum or Nutrient Starvation.
Chou PC, Rajput S, Zhao X, Patel C, Albaciete D, Oh WJ, Daguplo HQ, Patel N, Su B, Werlen G, Jacinto E. Chou PC, et al. Cells. 2020 Jun 27;9(7):1567. doi: 10.3390/cells9071567. Cells. 2020. PMID: 32605013 Free PMC article. - The Pasteur's Dictum: Nitrogen Promotes Growth and Oxygen Reduces the Need for Sugar.
Vadlakonda L, Reddy VD, Pasupuleti M, Reddanna P. Vadlakonda L, et al. Front Oncol. 2014 Mar 17;4:51. doi: 10.3389/fonc.2014.00051. eCollection 2014. Front Oncol. 2014. PMID: 24672772 Free PMC article. Review. No abstract available. - FoxO transcription factors in cancer metabolism.
Yadav RK, Chauhan AS, Zhuang L, Gan B. Yadav RK, et al. Semin Cancer Biol. 2018 Jun;50:65-76. doi: 10.1016/j.semcancer.2018.01.004. Epub 2018 Jan 5. Semin Cancer Biol. 2018. PMID: 29309929 Free PMC article. Review. - mTOR complex 2 signaling and functions.
Oh WJ, Jacinto E. Oh WJ, et al. Cell Cycle. 2011 Jul 15;10(14):2305-16. doi: 10.4161/cc.10.14.16586. Epub 2011 Jul 15. Cell Cycle. 2011. PMID: 21670596 Free PMC article. Review.
References
- Wullschleger S., Loewith R., Hall M. N. (2006) Cell. 124, 471–484 - PubMed
- Kim D. H., Sarbassov D. D., Ali S. M., King J. E., Latek R. R., Erdjument-Bromage H., Tempst P., Sabatini D. M. (2002) Cell. 110, 163–175 - PubMed
- Dann S. G., Selvaraj A., Thomas G. (2007) Trends Mol Med. 13, 252–259 - PubMed
Publication types
MeSH terms
Substances
LinkOut - more resources
Full Text Sources
Other Literature Sources
Molecular Biology Databases
Research Materials
Miscellaneous


