Paired analysis of TCRα and TCRβ chains at the single-cell level in mice - PubMed (original) (raw)
. 2011 Jan;121(1):288-95.
doi: 10.1172/JCI44752. Epub 2010 Dec 6.
Affiliations
- PMID: 21135507
- PMCID: PMC3007160
- DOI: 10.1172/JCI44752
Paired analysis of TCRα and TCRβ chains at the single-cell level in mice
Pradyot Dash et al. J Clin Invest. 2011 Jan.
Abstract
Characterizing the TCRα and TCRβ chains expressed by T cells responding to a given pathogen or underlying autoimmunity helps in the development of vaccines and immunotherapies, respectively. However, our understanding of complementary TCRα and TCRβ chain utilization is very limited for pathogen- and autoantigen-induced immunity. To address this problem, we have developed a multiplex nested RT-PCR method for the simultaneous amplification of transcripts encoding the TCRα and TCRβ chains from single cells. This multiplex method circumvented the lack of antibodies specific for variable regions of mouse TCRα chains and the need for prior knowledge of variable region usage in the TCRβ chain, resulting in a comprehensive, unbiased TCR repertoire analysis with paired coexpression of TCRα and TCRβ chains with single-cell resolution. Using CD8+ CTLs specific for an influenza epitope recovered directly from the pneumonic lungs of mice, this technique determined that 25% of such effectors expressed a dominant, nonproductively rearranged Tcra transcript. T cells with these out-of-frame Tcra mRNAs also expressed an alternate, in-frame Tcra, whereas approximately 10% of T cells had 2 productive Tcra transcripts. The proportion of cells with biallelic transcription increased over the course of a response, a finding that has implications for immune memory and autoimmunity. This technique may have broad applications in mouse models of human disease.
Figures
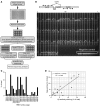
Figure 1. Unbiased single-cell amplification of TCR CDR3α and CDR3β.
(A) Schematic diagram of the multiplex PCR method used to simultaneously amplify and sequence the TCR CDR3α and CDR3β regions. Following single-cell sorting of KbPB1703+CD8+ T cells into a PCR plate, the first round of PCR used a primer mixture of 23 TRAV and 19 TRBV forward and single TRAC and TRBC reverse primers. Subsequently, a nested PCR was performed for α and β in a separate plate using a corresponding internal primer mix (23 TRAV forward, single TRAC reverse, and 19 TRBV forward, single TRBC reverse, respectively). (B) Schematic representation of the TCR CDR3 region, showing the relative positions of the oligonucleotide primers. An agarose gel electrophoresis image of TCR segments containing CDR3α and CDR3β amplified from single KbPB1703+CD8+ T cells is also shown. L, 100-bp ladder lane. The α and β products were loaded alternately in each twin-lane (separated by vertical lines). Negative control PCR reactions (for contamination) without any cDNA are shown in the boxed region. (C) TRBV usage in the primary KbPB1703+CD8+ T cell response determined by multiplex RT-PCR and sequencing (n = 9 mice). (D) Correlation of the data in C to data acquired by costaining tetramer-specific KbPB1703+CD8+ T cells with a panel of anti-TRBV antibodies.
Figure 2. Prevalence of out-of-frame TCRα transcripts in influenza epitope–specific peripheral CD8+ T cells.
Single-cell analysis of KbPB1703+CD8+ T cells (A) or DbPB1-F262+CD8+ T cells (B) obtained by BAL (day 10) from infected mice showed that 25% (of the 650 cells analyzed from 19 mice) and 15.6% (of the 192 cells analyzed from 8 mice) of total cells, respectively, expressed an out-of-frame Tcra transcript, whereas all Tcrb transcripts were in-frame. Each dot represents a single mouse. (C) Clonal frequency (25 clones from 14 mice) of individual out-of-frame sequences, with each dot representing a single clone. We considered 2 or more cells with identical CDR3α/CDR3β pairing as clonal. The number of sequences analyzed per mouse is shown. (D) Analysis of KbPB1703+CD8+ T cells from the BAL of Tcra–/+ mice on day 10 after primary infection showed no out-of-frame Tcra sequences. Each dot represents a single mouse.
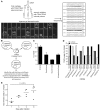
Figure 3. Biallelic expression of TCRα in KbPB1703+CD8+ T cells.
(A) Split RT-PCR of single cells shows both mono- (m) and biallelic (b) TCRα expression. The cDNA from a single cell was split 3 ways, and 2 rounds of PCR were used to amplify the CDR3α, as shown by agarose gel electrophoresis (vertical lines separate triplet-lanes). Some cells contained transcript from both alleles, others from a single allele. Most cells with nonproductive transcripts (bold) also had in-frame transcripts. (B) Schematic representation of the PCR sequencing-cloning-sequencing method used to identify the alternate allele. The PCR products (from single cells) that showed either an out-of-frame, in-frame, or unreadable overlap Tcra transcript sequence pairing with the identical CDR3β were cloned using TA cloning, and multiple products were sequenced. (C) The percentage of cells that had 2 transcripts (dual–in-frame and in-frame/out-of-frame) was 35%. In addition, approximately 42% and 23% of all cells analyzed had a monoallelic productive or nonproductive transcript, respectively (data derived from 3 mice and 240 split reactions). Values are mean ± SEM. (D) Comparing nonbiased amplification of TCRα by TRAV primers. Relative frequencies of in-frame and out-of-frame TCRαs paired with the same TCRβ showed that the varying efficiency of amplification was clone specific, rather than TRAV specific (data derived from 78 sequences from 5 mice). (E) KbPB1703+CD8+ T cells were analyzed on days 7, 8, 9, and 10 after primary virus challenge (672 cells from 16 individual mice) for the proportion of the total response represented by out-of-frame cells, showing a significant change (P = 0.0215) between day 7 and day 10.
Similar articles
- Paired TCRαβ analysis of virus-specific CD8(+) T cells exposes diversity in a previously defined 'narrow' repertoire.
Cukalac T, Kan WT, Dash P, Guan J, Quinn KM, Gras S, Thomas PG, La Gruta NL. Cukalac T, et al. Immunol Cell Biol. 2015 Oct;93(9):804-14. doi: 10.1038/icb.2015.44. Epub 2015 Mar 25. Immunol Cell Biol. 2015. PMID: 25804828 Free PMC article. - Unbiased analysis of TCRα/β chains at the single-cell level in human CD8+ T-cell subsets.
Sun X, Saito M, Sato Y, Chikata T, Naruto T, Ozawa T, Kobayashi E, Kishi H, Muraguchi A, Takiguchi M. Sun X, et al. PLoS One. 2012;7(7):e40386. doi: 10.1371/journal.pone.0040386. Epub 2012 Jul 6. PLoS One. 2012. PMID: 22792299 Free PMC article. - Single-Cell Analysis of T-Cell Receptor αβ Repertoire.
Dash P, Wang GC, Thomas PG. Dash P, et al. Methods Mol Biol. 2015;1343:181-97. doi: 10.1007/978-1-4939-2963-4_15. Methods Mol Biol. 2015. PMID: 26420718 - CDR3α drives selection of the immunodominant Epstein Barr virus (EBV) BRLF1-specific CD8 T cell receptor repertoire in primary infection.
Kamga L, Gil A, Song I, Brody R, Ghersi D, Aslan N, Stern LJ, Selin LK, Luzuriaga K. Kamga L, et al. PLoS Pathog. 2019 Nov 25;15(11):e1008122. doi: 10.1371/journal.ppat.1008122. eCollection 2019 Nov. PLoS Pathog. 2019. PMID: 31765434 Free PMC article. - Bi-Allelic TCRα or β Recombination Enhances T Cell Development but Is Dispensable for Antigen Responses and Experimental Autoimmune Encephalomyelitis.
Schuldt NJ, Auger JL, Hogquist KA, Binstadt BA. Schuldt NJ, et al. PLoS One. 2015 Dec 22;10(12):e0145762. doi: 10.1371/journal.pone.0145762. eCollection 2015. PLoS One. 2015. PMID: 26693713 Free PMC article.
Cited by
- Design and Application of Sensors for Chemical Cytometry.
Vickerman BM, Anttila MM, Petersen BV, Allbritton NL, Lawrence DS. Vickerman BM, et al. ACS Chem Biol. 2018 Jul 20;13(7):1741-1751. doi: 10.1021/acschembio.7b01009. Epub 2018 Feb 8. ACS Chem Biol. 2018. PMID: 29376326 Free PMC article. Review. - High-throughput and single-cell T cell receptor sequencing technologies.
Pai JA, Satpathy AT. Pai JA, et al. Nat Methods. 2021 Aug;18(8):881-892. doi: 10.1038/s41592-021-01201-8. Epub 2021 Jul 19. Nat Methods. 2021. PMID: 34282327 Free PMC article. Review. - Identifying T Cell Receptors from High-Throughput Sequencing: Dealing with Promiscuity in TCRα and TCRβ Pairing.
Lee ES, Thomas PG, Mold JE, Yates AJ. Lee ES, et al. PLoS Comput Biol. 2017 Jan 19;13(1):e1005313. doi: 10.1371/journal.pcbi.1005313. eCollection 2017 Jan. PLoS Comput Biol. 2017. PMID: 28103239 Free PMC article. - Quantifiable predictive features define epitope-specific T cell receptor repertoires.
Dash P, Fiore-Gartland AJ, Hertz T, Wang GC, Sharma S, Souquette A, Crawford JC, Clemens EB, Nguyen THO, Kedzierska K, La Gruta NL, Bradley P, Thomas PG. Dash P, et al. Nature. 2017 Jul 6;547(7661):89-93. doi: 10.1038/nature22383. Epub 2017 Jun 21. Nature. 2017. PMID: 28636592 Free PMC article. - Analysis of the paired TCR α- and β-chains of single human T cells.
Kim SM, Bhonsle L, Besgen P, Nickel J, Backes A, Held K, Vollmer S, Dornmair K, Prinz JC. Kim SM, et al. PLoS One. 2012;7(5):e37338. doi: 10.1371/journal.pone.0037338. Epub 2012 May 23. PLoS One. 2012. PMID: 22649519 Free PMC article.
References
- Blattman JN, Sourdive DJ, Murali-Krishna K, Ahmed R, Altman JD. Evolution of the T cell repertoire during primary, memory, and recall responses to viral infection. J Immunol. 2000;165(11):6081–6090. - PubMed
Publication types
MeSH terms
Substances
Grants and funding
- R01 AI070251/AI/NIAID NIH HHS/United States
- R25 CA023944/CA/NCI NIH HHS/United States
- AI077714/AI/NIAID NIH HHS/United States
- AI70251/AI/NIAID NIH HHS/United States
- HHSN266200700005C/AI/NIAID NIH HHS/United States
- K22 AI077714/AI/NIAID NIH HHS/United States
LinkOut - more resources
Full Text Sources
Other Literature Sources
Research Materials


