An oscillatory switch in mTOR kinase activity sets regulatory T cell responsiveness - PubMed (original) (raw)
An oscillatory switch in mTOR kinase activity sets regulatory T cell responsiveness
Claudio Procaccini et al. Immunity. 2010.
Abstract
There is a discrepancy between the in vitro anergic state of CD4(+)CD25(hi)FoxP3(+) regulatory T (Treg) cells and their in vivo proliferative capability. The underlying mechanism of this paradox is unknown. Here we show that the anergic state of Treg cells depends on the elevated activity of the mammalian target of rapamycin (mTOR) pathway induced by leptin: a transient inhibition of mTOR with rapamycin, before T cell receptor (TCR) stimulation, made Treg cells highly proliferative in the absence of exogenous interleukin-2 (IL-2). This was a dynamic and oscillatory phenomenon characterized by an early downregulation of the leptin-mTOR pathway followed by an increase in mTOR activation necessary for Treg cell expansion to occur. These data suggest that energy metabolism, through the leptin-mTOR-axis, sets responsiveness of Treg cells that use this information to control immune tolerance and autoimmunity.
Figures
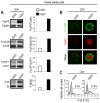
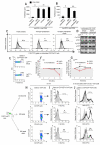
Figure 1. Freshly-isolated human Treg cells have active mTOR
(A) Immunoblot for FoxP3, P-mTOR, P-p70S6K and P-S6 in human freshly-isolated Treg cells and in CD4+CD25− effector T cells. Graphs show the relative densitometric quantitation of the gels shown. One representative of five independent experiments. (B) Confocal microscopy of freshly-isolated human Treg cells and effector T cells stained for P-mTOR (green) and FoxP3 (red). Representative of three independent experiments. (C) P-S6 expression in freshly-isolated effector T and Treg cells, respectively. Representative of three independent experiments. The gray histogram represents the isotype-matched negative control.
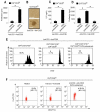
Figure 2. Transient mTOR inhibition with rapamycin, before anti-CD3 plus anti-CD28 stimulation, associates with proliferation of functional human Treg cells which upregulate FoxP3 expression
(A) Proliferation of Treg cells pretreated or not with rapamycin, before anti-CD3 plus anti-CD28 mAb stimulation. Data are shown as mean ± SD (n = 20, *p < 0.0001). (B) Contrast-phase microscopy showing clustering and activation of Treg cells pretreated or not with rapamycin. Representative experiment of ten. (C) IL-2 secretion by Treg cells pretreated or not with rapamycin, upon anti-CD3 plus anti-CD28 stimulation. The data are shown as mean ± SD (n = 4, *p < 0.001). (D) Proliferation of Treg cells pretreated or not with rapamycin in the presence or absence of IL-2 neutralizing mAb. The data are shown as mean ± SD (n = 4, *p < 0.001). (E) Proliferative response at 36h of CFSE-labelled effector T cells alone (left panel) or in co-culture with untreated (middle panel) or rapamycin-pretreated (right panel) unlabeled Treg cells. Representative of three independent experiments. (*p < 0.0001, **p < 0.001 when compared to CD4+CD25−CFSE+). (F) FoxP3 expression in Treg cells pretreated or not with rapamycin, after 36h stimulation with anti-CD3 plus anti-CD28. Representative of six independent experiments (*p < 0.01, as compared with anti-CD3 plus anti-CD28).
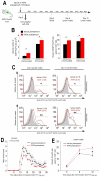
Figure 3. In vivo transient mTOR inhibition with rapamycin increases Treg cell proliferation in EGFP-FoxP3 mice and ameliorates RR-EAE
(A) Schematic model of the experimental design. Briefly, EGFP-FoxP3 reporter mice were daily treated with BrdU in basal conditions and upon antigen immunization with CFA and were injected with a single dose of rapamycin or vehicle, 12h before CFA priming, following proliferation of EGFP-FoxP3 cells overtime. Blood samples were obtained at 5 days and draining lymph nodes were harvested at day 8 and 12, respectively. (B) Absolute number and percentage of EGFP-FoxP3 cells gated on CD4+ cells in the lymph nodes from mice pretreated or not with rapamycin, immunized or not with CFA. The data are shown as mean ± SD (n = 6, *p < 0.01). (C) Flow cytometry for BrdU incorporation in EGFP-FoxP3 cells from the lymph nodes of EGFP-FoxP3 mice in vivo pretreated (red line) or not (black line) with rapamycin, in unimmunized or after 8 and 12 days immunization with CFA. Representative of three independent experiments (*p < 0.01 when compared with vehicle, **p < 0.001 when comparet with vehicle). The gray histogram represents the isotype-matched negative control. (D) Mean clinical score of RR-EAE in SJL/J female mice immunized with PLP139-155 preceded either by vehicle or 12h rapamycin pretreatment. Data are representative of two independent experiments with similar results (n = 5 mice per group, *p < 0.01). (E) Percentage of FoxP3+ cells gated on CD4+ cells isolated from the lymph nodes of SJL/J mice immunized with PLP139-155 peptide, pretreated or not with rapamycin before PLP139-151 priming. The data are shown as mean ± SD (n = 5 mice per group, *p < 0.01).
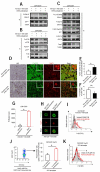
Figure 4. Early and late molecular events induced by mTOR inhibition in human and mouse Treg cells
(A) Immunoblot for P-ERK and p27Kip1, (B) P-mTOR, P-p70S6K, P-S6, and (C) P-Lck, P-Zap-70, P-AKT, P-STAT5 and FoxP3 on human Treg cells pretreated or not with rapamycin and then stimulated with anti-CD3 plus anti-CD28 for 1h. One representative out of five independent experiments. (D) Serial sections from non-reactive human lymph nodes (upper panels) or reactive human lymph nodes (lower panels) stained for Ki67, P-mTOR, and FoxP3. Number of FoxP3+ T cells (E) and expression of P-mTOR (F) in both reactive and non-reactive human lymph nodes. One representative out of three independent experiments is shown (*p < 0.005, **p < 0.001). (G) Proliferation of Treg cells pretreated or not with rapamycin, upon anti-CD3 plus anti-CD28 stimulation. The data are shown as mean ± SD (n = 20, *p < 0.0001). (H) Confocal microscopy on Treg cells pretreated or not with rapamycin, after 36h of anti-CD3 plus anti-CD28 stimulation, stained for P-mTOR (green) and FoxP3 (red). Representative of three independent experiments. (I) Flow cytometry for P-S6 expression in Treg cells pretreated (red line) or not (black line) with rapamycin, after 36h stimulation with anti-CD3 plus anti-CD28. Representative of three independent experiments (*p < 0.01 when compared with vehicle). The gray histogram represents the isotype-matched negative control. (J) Percentage of BrdU positive cells gated on CD4+EGFP-FoxP+ cells from lymph nodes of immunized EGFP-FoxP3 mice in vivo pretreated or not with rapamycin, and then in vitro stimulated with PPD. The data are shown as mean ± SD (n = 3, *p < 0.01). (K) Flow cytometry for P-S6 expression in EGFP-FoxP cells gated on CD4+ cells from lymph nodes of immunized EGFP-FoxP3 mice in vivo pretreated (red line) or not (black line) with rapamycin, and then stimulated in vitro with PPD. Representative of three independent experiments (n = 3, *p < 0.01 when compared with vehicle).
Figure 5. Leptin contributes to mTOR pathway activation in human and mouse Treg cells
(A) Proliferation of human Treg cells pretreated or not with rapamycin or anti-leptin neutralizing mAb or both, before anti-CD3 plus anti-CD28 stimulation. The data are shown as mean ± SD (n = 20, *p < 0.0001). (B) Proliferation of Treg cells pretreated or not with rapamycin before treatment with leptin (100 ng/ml) before anti-CD3 plus anti-CD28 stimulation. The data are shown as mean ± SD (n = 10, *p < 0.0001, **p < 0.001 ). (C) P-S6 expression (black line) in unstimulated Treg cells, freshly isolated (left panel), anti-leptin pretreated in the absence (middle panel) or in the presence of exogenous leptin (right panel), at 1h timepoint. Representative of three independent experiments (*p < 0.01 when compared with vehicle). The gray histogram is the isotype-matched negative control. (D) Immunoblot for P-mTOR, P-p70S6K and P-S6 on unstimulated Treg cells pretreated or not with rapamycin and then treated or not with leptin for 1h. One representative out of five independent experiments. (E) Ex-vivo P-S6 expression in Treg cells from _Lep_ob/ob mice treated or not with leptin after 2h from intreperitoneal injection (n = 3 mice/group, representative of three independent experiments). (F-G) Time course of fold changes in P-S6 expression in Treg cells from WT (F) or leptin-deficient _Lep_ob/ob mice (G), intraperitoneally injected with rapamycin (red line) or leptin (black line), as compared with vehicle-treated mice. Representative of three independent experiments (*p < 0.01 when compared with vehicle). (H) Percentage of EGFP-FoxP3 cells gated on CD4+ cells from lymph nodes of ad libitum fed, 48h fasted and 48h fasted + leptin EGFP-FoxP3 mice. Representative of two independent experiments (n = 3 mice/group). (I) P-S6 expression (black line) in EGFP-FoxP3 cells gated on CD4+ cells from lymph nodes of ad libitum fed, 48h fasted and 48h fasted + leptin EGFP-FoxP3 mice. Representative of two independent experiments (n = 3 mice/group, *p < 0.01 when compared with ad libitum fed; ** p < 0.05 compared with 48h fasted). The gray histogram is the isotype-matched negative control. (J) Flow cytometry for BrdU incorporation in EGFP-FoxP3 cells from the lymph nodes of ad libitum fed, 48h fasted and 48h fasted + leptin EGFP-FoxP3 mice, and then stimulated in vitro with anti-CD3 plus anti-CD28. Representative of two independent experiments (n = 3, *p < 0.01 when compared with ad libitum fed; ** p < 0.05 compared with 48h fasted). The gray histogram represents the isotype-matched negative control.
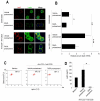
Figure 6. Rapamycin pre-treatment reduces the expression of leptin and LepR in Treg cells
(A) Confocal microscopy of human Treg cells pretreated or not with rapamycin, in presence or absence of anti-CD3 plus anti-CD28 stimulation, stained for LepR (red) and leptin (green). Representative of three independent experiments (B) Realtime PCR for leptin in human Treg cell pretreated or not with rapamycin, in the presence or absence of anti-CD3 plus anti-CD28 stimulation. The data are shown as mean ± SD (n = 5, *p < 0.05; **p < 0.0001; ***p < 0.001). (C) Dot plots show beads-based ELISA for leptin in cell supernatant from Treg cells, pretreated or not with rapamycin, in the presence or not of anti-CD3 plus anti-CD28 stimulation. Representative of three independent experiments. (D) Graph shows quantitation of leptin production in cell supernatant from Treg cells in all the above conditions. The data are shown as mean ± SD (n = 3, *p < 0.0001).
Figure 7. Treg cells from LepR-deficient _Lepr_db/db mice have reduced mTOR activation concomitantly with a higher proliferative capacity
Immunoblot for FoxP3 (A), P-mTOR, P-p70S6K, P-S6 (B), and P-ERK and p27Kip1 (C) in Treg cells from _Lepr_db/+ lean controls and leptin-receptor deficient _Lepr_db/db mice stimulated or not with anti-CD3 plus anti-CD28 for 1h. One representative out of four independent experiments. (D) Proliferation of Treg cells from _Lepr_db/+ and _Lepr_db/db mice, stimulated or not with anti-CD3 plus anti-CD28 mAb. The data are shown as mean ± SD (n = 10, *p < 0.0001). (E) P-S6 expression in Treg cells from _Lepr_db/+ (black line) or _Lepr_db/db (red line) mice in the presence or absence of anti-CD3 plus anti-CD28 in 36h culture. Representative of three independent experiments. The gray histogram represents the isotype-matched negative control. (F) P-S6 mean fluorescence intensity in both strains of mice with or without anti-CD3 plus anti-CD28 stimulation and (G) fold change in P-S6. (*p < 0.01 when compared with unstimulated cells). _Lepr_db/db mice had a much higher P-S6 induction than heterozygote controls during proliferation. Representative of three independent experiments.
Comment in
- Regulatory T cells: Weight watchers.
Bordon Y. Bordon Y. Nat Rev Immunol. 2011 Feb;11(2):72. doi: 10.1038/nri2920. Epub 2011 Jan 14. Nat Rev Immunol. 2011. PMID: 21467973 No abstract available.
Similar articles
- Synergy between rapamycin and FLT3 ligand enhances plasmacytoid dendritic cell-dependent induction of CD4+CD25+FoxP3+ Treg.
Biswas M, Sarkar D, Kumar SR, Nayak S, Rogers GL, Markusic DM, Liao G, Terhorst C, Herzog RW. Biswas M, et al. Blood. 2015 May 7;125(19):2937-47. doi: 10.1182/blood-2014-09-599266. Epub 2015 Apr 1. Blood. 2015. PMID: 25833958 Free PMC article. - Oscillatory mTOR inhibition and Treg increase in kidney transplantation.
Sabbatini M, Ruggiero G, Palatucci AT, Rubino V, Federico S, Giovazzino A, Apicella L, Santopaolo M, Matarese G, Galgani M, Terrazzano G. Sabbatini M, et al. Clin Exp Immunol. 2015 Nov;182(2):230-40. doi: 10.1111/cei.12669. Epub 2015 Aug 28. Clin Exp Immunol. 2015. PMID: 26077103 Free PMC article. - Interplay between mTOR and STAT5 signaling modulates the balance between regulatory and effective T cells.
Shan J, Feng L, Sun G, Chen P, Zhou Y, Xia M, Li H, Li Y. Shan J, et al. Immunobiology. 2015 Apr;220(4):510-7. doi: 10.1016/j.imbio.2014.10.020. Epub 2014 Oct 31. Immunobiology. 2015. PMID: 25468562 - mTOR signaling: A pivotal player in Treg cell dysfunction in systemic lupus erythematosus.
Zhao X, Wang S, Wang S, Xie J, Cui D. Zhao X, et al. Clin Immunol. 2022 Dec;245:109153. doi: 10.1016/j.clim.2022.109153. Epub 2022 Oct 17. Clin Immunol. 2022. PMID: 36265758 Review. - Regulatory T cells, mTOR kinase, and metabolic activity.
Procaccini C, Matarese G. Procaccini C, et al. Cell Mol Life Sci. 2012 Dec;69(23):3975-87. doi: 10.1007/s00018-012-1058-6. Epub 2012 Jul 4. Cell Mol Life Sci. 2012. PMID: 22760498 Free PMC article. Review.
Cited by
- Impact of Metabolic Syndrome on Neuroinflammation and the Blood-Brain Barrier.
Van Dyken P, Lacoste B. Van Dyken P, et al. Front Neurosci. 2018 Dec 11;12:930. doi: 10.3389/fnins.2018.00930. eCollection 2018. Front Neurosci. 2018. PMID: 30618559 Free PMC article. Review. - Leptin signaling impairs macrophage defenses against Salmonella Typhimurium.
Fischer J, Gutièrrez S, Ganesan R, Calabrese C, Ranjan R, Cildir G, Hos NJ, Rybniker J, Wolke M, Fries JWU, Tergaonkar V, Plum G, Antebi A, Robinson N. Fischer J, et al. Proc Natl Acad Sci U S A. 2019 Aug 13;116(33):16551-16560. doi: 10.1073/pnas.1904885116. Epub 2019 Jul 26. Proc Natl Acad Sci U S A. 2019. PMID: 31350351 Free PMC article. - Metabolic Control of Treg Cell Stability, Plasticity, and Tissue-Specific Heterogeneity.
Shi H, Chi H. Shi H, et al. Front Immunol. 2019 Dec 11;10:2716. doi: 10.3389/fimmu.2019.02716. eCollection 2019. Front Immunol. 2019. PMID: 31921097 Free PMC article. Review. - Metabolic profiles of regulatory T cells and their adaptations to the tumor microenvironment: implications for antitumor immunity.
Yan Y, Huang L, Liu Y, Yi M, Chu Q, Jiao D, Wu K. Yan Y, et al. J Hematol Oncol. 2022 Aug 10;15(1):104. doi: 10.1186/s13045-022-01322-3. J Hematol Oncol. 2022. PMID: 35948909 Free PMC article. Review. - Emerging role of mTOR in tumor immune contexture: Impact on chemokine-related immune cells migration.
Jin J, Zhao Q. Jin J, et al. Theranostics. 2020 May 15;10(14):6231-6244. doi: 10.7150/thno.45219. eCollection 2020. Theranostics. 2020. PMID: 32483450 Free PMC article. Review.
References
- Abizaid A, Gao Q, Horvath TL. Thoughts for food: brain mechanisms and peripheral energy balance. Neuron. 2006;51:691–702. - PubMed
- Battaglia M, Stabilini A, Roncarolo MG. Rapamycin selectively expands CD4+CD25+FoxP3+ regulatory T cells. Blood. 2005;105:4743–4748. - PubMed
- Becker T, Loch G, Beyer M, Zinke I, Aschenbrenner AC, Carrera P, Inhester T, Shultze JL, Hoch M. FOXO-dependent regulation of innate immune homeostasis. Nature. 2010;463:369–373. - PubMed
Publication types
MeSH terms
Substances
Grants and funding
- DP1 OD006850/OD/NIH HHS/United States
- DO10D006850/PHS HHS/United States
- 202579/ERC_/European Research Council/International
- AR53239/AR/NIAMS NIH HHS/United States
- R01 AR053239-05/AR/NIAMS NIH HHS/United States
- GJT08004/TI_/Telethon/Italy
- R01 AR053239/AR/NIAMS NIH HHS/United States
LinkOut - more resources
Full Text Sources
Other Literature Sources
Molecular Biology Databases
Research Materials
Miscellaneous
