cis-Proline-mediated Ser(P)5 dephosphorylation by the RNA polymerase II C-terminal domain phosphatase Ssu72 - PubMed (original) (raw)
cis-Proline-mediated Ser(P)5 dephosphorylation by the RNA polymerase II C-terminal domain phosphatase Ssu72
Jon W Werner-Allen et al. J Biol Chem. 2011.
Abstract
RNA polymerase II coordinates co-transcriptional events by recruiting distinct sets of nuclear factors to specific stages of transcription via changes of phosphorylation patterns along its C-terminal domain (CTD). Although it has become increasingly clear that proline isomerization also helps regulate CTD-associated processes, the molecular basis of its role is unknown. Here, we report the structure of the Ser(P)(5) CTD phosphatase Ssu72 in complex with substrate, revealing a remarkable CTD conformation with the Ser(P)(5)-Pro(6) motif in the cis configuration. We show that the cis-Ser(P)(5)-Pro(6) isomer is the minor population in solution and that Ess1-catalyzed cis-trans-proline isomerization facilitates rapid dephosphorylation by Ssu72, providing an explanation for recently discovered in vivo connections between these enzymes and a revised model for CTD-mediated small nuclear RNA termination. This work presents the first structural evidence of a cis-proline-specific enzyme and an unexpected mechanism of isomer-based regulation of phosphorylation, with broad implications for CTD biology.
Figures
FIGURE 1.
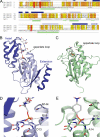
Structure of Ser(P)5 CTD phosphatase Ssu72. A, sequence alignment of Ssu72 orthologues and the LMW PTP Lpt1. Ssu72 proteins from D. melanogaster (Dm Ssu72), human (Hs Ssu72), and S. cerevisiae (Sc Ssu72) are shown with conserved and similar residues highlighted in orange and yellow, respectively. α-Helices and β-strands from the structures of dSsu72 and Lpt1 (PDB code 1D1Q) are denoted with cylinders and arrows, respectively. The secondary structure elements of Ssu72 that comprise the two additions to the LMW PTP scaffold are colored dark blue to match the structure in B. Catalytic residues are highlighted in red. B, ribbon diagram of the dSsu72-pCTD complex. Additions to the LMW PTP fold are colored dark blue. The substrate peptide and catalytic residues Cys13 (mutated to Asp13), Arg19, and Asp144 (mutated to Asn144) are shown as sticks. C, ribbon diagram of the LMW PTP Lpt1. The Lpt1 structure shows a catalytic mutant bound to the substrate _p_-nitrophenyl phosphate (PDB code 1D1Q). The substrate and catalytic residues Cys14 (mutated to Ala14), Arg20, and Asp133 are shown as sticks. D and E, active site close-ups of substrate-bound dSsu72 (D) and Lpt1 (E). The backbone of the phosphate-binding loops is shown as sticks along with important catalytic residues. Hydrogen bonds are represented by gray dashed lines.
FIGURE 2.
Binding of c_is_-proline pCTD substrate by Ssu72. A, orthogonal views of pCTD conformation and binding. The enzyme structure is shown in tan with yellow highlighting for the active site loop, and residues that form the substrate recognition surface are labeled and shown as green sticks. The gray mesh represents the Fo − Fc omit map density (contoured at 3.0σ) surrounding the substrate. B, schematic of the Ssu72-pCTD interaction. Hydrogen bonds and van der Waal contacts are shown as red and blue dashed lines, respectively. The green line represents an intramolecular hydrogen bond in the pCTD substrate. C and D, examples of cis and trans substrate configurations. The conformations of Ser(P)5 CTD peptides in complex with dSsu72 (C) and phosphatase Scp1 (D) are shown with the Ser(P)5–Pro6 peptide bond highlighted in magenta. For clarity, only residues Pro3 to Ser7 are shown. The cis isomer is stabilized by an intramolecular hydrogen bond (gray dashed line) and causes a severe kink in the CTD backbone.
FIGURE 3.
Measurement of proline isomer populations for Ser(P)5 CTD substrate. A and B, natural abundance 13C-heteronuclear single quantum correlation spectra were collected for the substrate peptide (A) and a shorter pCTD peptide with only one proline residue (B). Close-up views depict the proline β- and γ-region in each spectrum. Colored boxes indicate the range of chemical shifts (mean ± S.D.) for each proline atom in either the cis (blue) or the trans (green) form (43). pS5, Ser(P)5. C, carbon; HC, proton.
FIGURE 4.
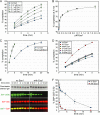
Ess1 stimulates pCTD dephosphorylation by Ssu72. A, the activity of Ssu72 was monitored with various concentrations of the proline isomerase Ess1. The maximum stimulation was ∼2-fold under these conditions. In A–D, each point represents the average from three independent reactions, and error bars denote S.D. B, Ess1 enhancement of Ssu72 activity is saturable. The last points of the reactions in A are plotted versus Ess1 concentration, with black circles representing reactions omitted from A for clarity. C, pCTD dephosphorylation by Ssu72 reaches completion without Ess1. The no Ess1 reaction in A was monitored over 25 min and reached ∼90% completion in 20 min, 4-fold slower than the reaction with 2 μ
m
Ess1. D, four catalytically impaired Ess1 mutants fail to significantly stimulate Ssu72. Reactions contained 1 μ
m
of each Ess1 protein. Residual enhancement corresponds to a 50–100-fold reduction of WT Ess1 activity (compare with A). E and F, Ess1 stimulates Ssu72 dephosphorylation of full-length pCTD. The 26-repeat S. cerevisiae CTD was hyperphosphorylated in vitro and used as a substrate in reactions monitored by Western blotting with Ser(P)5 (S5P)-specific antibodies. As a control, Ser(P)2 (S2P) levels were also measured; the apparent increase in the S2 signal is likely due to a higher affinity of the S2 antibody for singly phosphorylated Ser(P)2 heptads over doubly phosphorylated Ser(P)2/Ser(P)5 heptads, as reported for other Ser(P)2-specific antibodies (44). Ser(P)5 CTD levels were quantified with infrared imaging, and the resulting substrate depletion curves are shown in F. Each point represents the average of three independent reactions, and error bars denote S.D.
FIGURE 5.
A new model for Ess1-regulated Ssu72 activity. RNAPII (Pol II) is shown near the termination of an snRNA transcript. For clarity, only one CTD heptad is labeled. The upper (gray) and lower (light blue) panels represent the trans and cis forms, respectively, of the Ser(P)5–Pro6 motif. Dephosphorylation cannot proceed through the trans form (red cross) due to the _cis_-proline substrate specificity of Ssu72. Instead, Ess1 catalyzes the interconversion of isomers, which is the rate-limiting step for Ssu72 activity. The minor pathway is indicated with gray arrows, with the dashed line representing non-catalyzed isomerization that occurs very slowly comparison with transcriptional events. The change in CTD phosphorylation facilitates proper termination by promoting the release of Nrd1 and recruiting Pcf11.
Similar articles
- Diverse and conserved roles of the protein Ssu72 in eukaryotes: from yeast to higher organisms.
Liu C, Zhang W, Xing W. Liu C, et al. Curr Genet. 2021 Apr;67(2):195-206. doi: 10.1007/s00294-020-01132-5. Epub 2020 Nov 26. Curr Genet. 2021. PMID: 33244642 Review. - Structural determinants for accurate dephosphorylation of RNA polymerase II by its cognate C-terminal domain (CTD) phosphatase during eukaryotic transcription.
Irani S, Sipe SN, Yang W, Burkholder NT, Lin B, Sim K, Matthews WL, Brodbelt JS, Zhang Y. Irani S, et al. J Biol Chem. 2019 May 24;294(21):8592-8605. doi: 10.1074/jbc.RA119.007697. Epub 2019 Apr 10. J Biol Chem. 2019. PMID: 30971428 Free PMC article. - Crystal structure of the human symplekin-Ssu72-CTD phosphopeptide complex.
Xiang K, Nagaike T, Xiang S, Kilic T, Beh MM, Manley JL, Tong L. Xiang K, et al. Nature. 2010 Oct 7;467(7316):729-33. doi: 10.1038/nature09391. Epub 2010 Sep 22. Nature. 2010. PMID: 20861839 Free PMC article. - novel modifications on C-terminal domain of RNA polymerase II can fine-tune the phosphatase activity of Ssu72.
Luo Y, Yogesha SD, Cannon JR, Yan W, Ellington AD, Brodbelt JS, Zhang Y. Luo Y, et al. ACS Chem Biol. 2013 Sep 20;8(9):2042-52. doi: 10.1021/cb400229c. Epub 2013 Jul 23. ACS Chem Biol. 2013. PMID: 23844594 Free PMC article. - Ssu72 Dual-Specific Protein Phosphatase: From Gene to Diseases.
Hwang S, Kim MH, Lee CW. Hwang S, et al. Int J Mol Sci. 2021 Apr 6;22(7):3791. doi: 10.3390/ijms22073791. Int J Mol Sci. 2021. PMID: 33917542 Free PMC article. Review.
Cited by
- Cross-talk of phosphorylation and prolyl isomerization of the C-terminal domain of RNA Polymerase II.
Yogesha SD, Mayfield JE, Zhang Y. Yogesha SD, et al. Molecules. 2014 Jan 27;19(2):1481-511. doi: 10.3390/molecules19021481. Molecules. 2014. PMID: 24473209 Free PMC article. Review. - Structure and function of pre-mRNA 5'-end capping quality control and 3'-end processing.
Jurado AR, Tan D, Jiao X, Kiledjian M, Tong L. Jurado AR, et al. Biochemistry. 2014 Apr 1;53(12):1882-98. doi: 10.1021/bi401715v. Epub 2014 Mar 20. Biochemistry. 2014. PMID: 24617759 Free PMC article. - The Nrd1-Nab3-Sen1 transcription termination complex from a structural perspective.
Chaves-Arquero B, Pérez-Cañadillas JM. Chaves-Arquero B, et al. Biochem Soc Trans. 2023 Jun 28;51(3):1257-1269. doi: 10.1042/BST20221418. Biochem Soc Trans. 2023. PMID: 37222282 Free PMC article. Review. - Structural insight into recognition of phosphorylated threonine-4 of RNA polymerase II C-terminal domain by Rtt103p.
Jasnovidova O, Krejcikova M, Kubicek K, Stefl R. Jasnovidova O, et al. EMBO Rep. 2017 Jun;18(6):906-913. doi: 10.15252/embr.201643723. Epub 2017 May 2. EMBO Rep. 2017. PMID: 28468956 Free PMC article. - Diverse and conserved roles of the protein Ssu72 in eukaryotes: from yeast to higher organisms.
Liu C, Zhang W, Xing W. Liu C, et al. Curr Genet. 2021 Apr;67(2):195-206. doi: 10.1007/s00294-020-01132-5. Epub 2020 Nov 26. Curr Genet. 2021. PMID: 33244642 Review.
References
- Meinhart A., Kamenski T., Hoeppner S., Baumli S., Cramer P. (2005) Genes Dev. 19, 1401–1415 - PubMed
- Phatnani H. P., Greenleaf A. L. (2006) Genes Dev. 20, 2922–2936 - PubMed
- Buratowski S. (2003) Nat. Struct. Biol. 10, 679–680 - PubMed
Publication types
MeSH terms
Substances
LinkOut - more resources
Full Text Sources
Other Literature Sources
Molecular Biology Databases


