Role of endoplasmic reticulum stress in epithelial-mesenchymal transition of alveolar epithelial cells: effects of misfolded surfactant protein - PubMed (original) (raw)
. 2011 Sep;45(3):498-509.
doi: 10.1165/rcmb.2010-0347OC. Epub 2010 Dec 17.
Beiyun Zhou, David K Ann, Parviz Minoo, Yixin Liu, Agnes Banfalvi, Manda S Krishnaveni, Mickael Dubourd, Lucas Demaio, Brigham C Willis, Kwang-Jin Kim, Roland M duBois, Edward D Crandall, Michael F Beers, Zea Borok
Affiliations
- PMID: 21169555
- PMCID: PMC3175581
- DOI: 10.1165/rcmb.2010-0347OC
Role of endoplasmic reticulum stress in epithelial-mesenchymal transition of alveolar epithelial cells: effects of misfolded surfactant protein
Qian Zhong et al. Am J Respir Cell Mol Biol. 2011 Sep.
Abstract
Endoplasmic reticulum (ER) stress has been implicated in alveolar epithelial type II (AT2) cell apoptosis in idiopathic pulmonary fibrosis. We hypothesized that ER stress (either chemically induced or due to accumulation of misfolded proteins) is also associated with epithelial-mesenchymal transition (EMT) in alveolar epithelial cells (AECs). ER stress inducers, thapsigargin (TG) or tunicamycin (TN), increased expression of ER chaperone, Grp78, and spliced X-box binding protein 1, decreased epithelial markers, E-cadherin and zonula occludens-1 (ZO-1), increased the myofibroblast marker, α-smooth muscle actin (α-SMA), and induced fibroblast-like morphology in both primary AECs and the AT2 cell line, RLE-6TN, consistent with EMT. Overexpression of the surfactant protein (SP)-C BRICHOS mutant SP-C(ΔExon4) in A549 cells increased Grp78 and α-SMA and disrupted ZO-1 distribution, and, in primary AECs, SP-C(ΔExon4) induced fibroblastic-like morphology, decreased ZO-1 and E-cadherin and increased α-SMA, mechanistically linking ER stress associated with mutant SP to fibrosis through EMT. Whereas EMT was evident at lower concentrations of TG or TN, higher concentrations caused apoptosis. The Src inhibitor, 4-amino-5-(4-chlorophenyl)-7-(t-butyl)pyrazolo[3,4]pyramidine) (PP2), abrogated EMT associated with TN or TG in primary AECs, whereas overexpression of SP-C(ΔExon4) increased Src phosphorylation, suggesting a common mechanism. Furthermore, increased Grp78 immunoreactivity was observed in AT2 cells of mice after bleomycin injury, supporting a role for ER stress in epithelial abnormalities in fibrosis in vivo. These results demonstrate that ER stress induces EMT in AECs, at least in part through Src-dependent pathways, suggesting a novel role for ER stress in fibroblast accumulation in pulmonary fibrosis.
Figures
Figure 1.
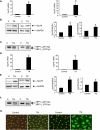
Tunicamycin (TN) and thapsigargin (TG) induce endoplasmic reticulum (ER) stress in RLE-6TN cells and alveolar epithelial cells (AECs). (A) qPCR of Grp78 in RLE-6TN cells on Day 2 in culture, and (B) representative Western blot and quantitative analysis of Grp78 in RLE-6TN cells on Day 3 in culture, after treatment on Day 1 after plating with TN (2.5 μg/ml) for 24 hours, TG (0.3 μM) for 6 hours, or DMSO (vehicle control [C]). RNA and protein were harvested at 24 and 48 hours after initiation of treatment, respectively. qPCR was normalized to β-actin in (A) (n = 5 for TN; n = 4 for TG for Grp78 mRNA; n = 5 for Grp78 protein for both TN and TG). Glyceraldehyde 3-phosphate dehydrogenase (GAPDH) is shown as a loading control in (B). (C) PCR analysis (n = 2) of spliced X-box binding protein (XBP)–1 in RLE-6TN cells on Day 2 in culture treated on Day 1 after plating with TN, TG, or DMSO as in (B). Both XBP-1U and XBP-1S were amplified by RT-PCR and separated by 2% agarose gel electrophoresis. (D) qPCR and (E) representative Western blot and quantitative analysis of Grp78 in primary AECs treated on Day 2 after plating with TN (1 μg/ml) for 24 hours and TG (0.2 μM) for 30 minutes, or DMSO (vehicle control). RNA and protein were harvested after 24 and 48 hours, respectively. Grp78 mRNA levels shown in (D) were normalized to β-actin (n = 4 for Grp78 RNA for both TN and TG; n = 5 for TN; n = 4 for TG for Grp78 protein). GAPDH is shown as a loading control in (E). (F) Representative PCR analysis (n = 3) of spliced XBP-1 in AECs treated with TN and TG or DMSO, as described in (D) and (E). XBP-1U and XBP-1S were amplified by RT-PCR on Day 3 in culture. (G) Immunofluorescence analysis (n = 2) of Grp78 (FITC, green) in AECs treated on Day 2 with TN or TG shown on Day 3 after plating for TN treatment and on Day 7 after plating for TG treatment. Nuclei (red) were stained with propidium iodide (PI). Controls were treated with DMSO (vehicle). Original magnification, ×400. *P < 0.05 compared with control.
Figure 2.
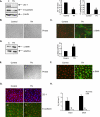
TN induces epithelial–mesenchymal transition (EMT) in RLE-6TN cells and AECs. (A) Representative Western blot and quantitative analysis of zonula occludens (ZO)–1 and E-cadherin in RLE-6TN cells treated with TN (2.5 μg/ml) or DMSO (vehicle control) for 24 hours on Day 1 after plating and analyzed on Day 3 (n = 3). *P < 0.05 compared with DMSO; β-actin is shown as loading control. Phase and immunofluorescence images (n = 2) of RLE-6TN cells on Day 3 after plating showing cell morphology (B) and α–smooth muscle actin (α-SMA) reactivity (C) after treatment with TN (2.5 μg/ml) (ii) or DMSO (i) for 24 hours on Day 1. Original magnification for phase image, ×100, and for immunofluorescence, ×400. Nuclei (red) were stained with PI. (D) Representative Western blot and quantitative analysis of α-SMA in RLE-6TN cells treated with TN (2.5 μg/ml) or DMSO (vehicle control) for 24 hours on Day 1 after plating and analyzed on Day 3 (n = 3). *P < 0.05 compared with DMSO. GAPDH is shown as loading control. Phase and immunofluorescence images (n = 2) of AEC monolayers show cell morphology on Day 7 (E) and α-SMA reactivity on Day 3 (F) after treatment with 1 μg/ml TN (ii) or DMSO (i) for 24 hours on Day 2. Original magnification for phase image, ×100, and for immunofluorescence, ×400. Nuclei (red) were stained with PI. (G) Immunofluorescence images (n = 2) of AEC monolayer treated with TN or DMSO on Day 2 after plating and stained for ZO-1 (red) (i and ii) and E-cadherin (green) (iii and iv) on Day 3. Nuclei were stained with DAPI (blue) for ZO-1 and with PI (red) for E-cadherin. Original magnification, ×400. (H) Transepithelial resistance (RT) of AEC monolayers treated with TN or DMSO on Day 2 after plating was measured using a volt-ohmmeter on Days 3 and 5 after plating (n = 4 cell preparations). *P < 0.05 compared with DMSO.
Figure 3.
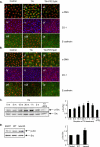
Induction of Grp78 and α-SMA and loss of ZO-1 and E-cadherin by overexpression of mutant surfactant protein (SP)–CΔexon4 in A549 cells and primary AECs. Representative Western blot (A) and quantitative analysis (B) of Grp78 and α-SMA on Day 3 after plating in A549 cells transduced with lentiviral vectors encoding enhanced green fluorescent protein (EGFP) (control), SP-Cwild-type (WT), and SP-CΔexon4 (Δexon4) on Day 1 (n = 3). (C) Immunofluorescence microscopy (n = 2) of ZO-1 (red) on Day 3 after plating in A549 cells transduced with lentiviral vectors (green) encoding EGFP (control), SP-Cwild-type (WT), and SP-CΔexon4 (Δexon4) on Day 1. Nuclei were counterstained with DAPI (blue). Original magnification, ×400. (D) Immunofluorescence microscopy and phase images (n = 3) of primary AECs on Day 10 after plating showing cell morphology after transduction with lentiviral vectors (green) encoding EGFP (control), SP-Cwild-type (WT), and SP-CΔexon4 (Δexon4) on Day 2. Original magnification, ×200. (E) Representative Western blot and quantitative analysis of ZO-1, E-cadherin, and α-SMA on Day 10 after plating in AECs transduced with lentiviral vectors encoding EGFP (control), SP-Cwild-type (WT), and SP-CΔexon4 (Δexon4) on Day 2 (n = 3). Lamin A/C and GAPDH are shown as loading controls in (A) and (E), respectively. *P < 0.05 compared with control.
Figure 4.
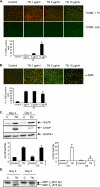
Effects of ER stress induced by TN are dose dependent. Immunofluorescence images and quantitative analysis of AECs treated with increasing doses of TN (1–10μg/ml) for 24 hours on Day 2 analyzed via terminal deoxynucleotidyltransferase-mediated dUTP nick end labeling (TUNEL) assay (A) and immunostaining for α-SMA (B) on Day 3 after plating. DMSO was used as vehicle control. Percentages of TUNEL-positive cells and cells expressing α-SMA were quantified in each condition by counting cells and analyzed by one-way ANOVA. *P < 0.05 compared with all other conditions. (C) Representative Western blot and quantitative analysis (n = 3) of Grp78 and CHOP in AECs treated with TN (1 μg/ml) for 24 hours on Day 2 after plating. Protein was harvested on Days 3 and 5 after plating. GAPDH is shown as loading control. *P < 0.05 compared with TN on Day 3. (D) PCR analysis (n = 2) of spliced XBP-1 in AECs treated with TN (1 μg/ml). Both XBP-1U and XBP-1S were amplified by RT-PCR from RNA harvested on Days 3 and 5, and separated by 2% agarose gel electrophoresis.
Figure 5.
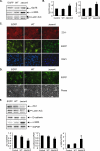
Role of Src activation in ER stress–induced EMT. (A) Immunofluorescence microscopy of AECs grown on Transwell filters treated with TN (1 μg/ml) for 24 hours, or pretreated with 4-amino-5-(4-chlorophenyl)-7-(_t_-butyl)pyrazolo[3,4-_d_]pyramidine (PP2) (5 μM) for 1 hour and then treated with PP2 (5 μM) and TN (1 μg/ml) for 24 hours, on Day 2 after plating, and stained for α-SMA (green) (i, ii, and iii), ZO-1 (red) (iv, v, and vi), and E-cadherin (green) (vii, viii, and ix) on Day 3 (n = 2). Monolayers immunostained for α-SMA or E-cadherin were counterstained with PI (red); monolayers immunostained for ZO-1 were counterstained with DAPI (blue). Original magnification, ×400. (B) Immunofluorescence microscopy (n = 2) on Day 3 of AECs grown on filters treated on Day 2 with TG (0.2 μM) alone for 30 minutes, or pretreated with PP2 (5 μM) for 1 hour and then treated with PP2 (5 μM) and TG (0.2 μM) for 30 minutes and stained for α-SMA (green) (i, ii, and iii), ZO-1 (red) (iv, v, and vi) and E-cadherin (green) (vii, viii, and ix). Monolayers immunostained for α-SMA or E-cadherin were counterstained with PI (red); monolayers immunostained for ZO-1 were counterstained with DAPI (blue). Original magnification, ×400. (C) Representative Western blot and quantitative analysis of phosphorylated Src (p-Src) and total Src in AECs treated with TN (1 μg/ml) for indicated times on Day 2 after plating (n = 3). To confirm inhibitory effects of PP2 on Src phosphorylation, cells were pretreated with PP2 (5 μM) for 1 hour, followed by treatment with PP2 together with TN for an additional 1 hour. *P < 0.05 compared with 0 minutes. (D) Representative Western blot and quantitative analysis of p-Src and total Src (n = 3) on Day 2 in A549 cells transduced with lentiviral vectors encoding EGFP (control), SP-Cwild-type (WT), and SP-CΔexon4 (Δexon4) on Day 1. *P < 0.05 compared with control.
Figure 6.
Increased Grp78 expression in AECs in mouse lung after bleomycin administration. Frozen lung sections from Nkx2.1-Cre;LacZ mice (n = 2) were stained with X-gal followed by immunocytochemistry for Grp78 (FITC, green) 12 days after intranasal administration of saline (control) (A) or bleomycin (6 U/kg) (B). Nuclei (red) were stained with PI. Original magnification for (A) and (B), ×400. Arrows indicate Grp78-positive cells that are X-gal–positive of epithelial origin.
Figure 7.
Model for ER stress–induced EMT in AECs. Pharmacologic treatment of AECs (TN or TG) or transduced expression of aggregation-prone SP-C BRICHOS mutant promotes activation of the unfolded protein response (UPR). In an effort by the cell to restore proteostasis, UPR uses inositol-requiring enzyme (IRE)–1/XBP1 signaling to up-regulate folding machinery, including the chaperone Grp78. Two other UPR signaling pathways (dotted lines) that further promote folding (mediated by activating transcription factor [ATF]–6) or limit new protein synthesis (mediated by pancreatic ER kinase [PKR]–like ER kinase [PERK]) have also been shown to be activated by similar treatments (48). By definition, “ER stress” ensues when UPR cannot restore protein folding. Under conditions of “extensive” ER stress (modeled here by treatment with higher doses of TN), activation of CHOP and apoptosis can ensue, although aggregated protein conformers may also induce apoptosis by CHOP-independent (JNK, caspase 4, or mitochondrial cytochrome C/caspase 9) pathways (denoted by dashed line). Alternatively, as a prosurvival mechanism, “mild ER stress” (modeled with lower dose TN) promotes Src phosphorylation and results in EMT (demonstrated here as down-regulation of tight and adherens junction proteins [ZO-1 and E-cadherin], up-regulation of α-SMA, and alteration of cell morphology). The Src inhibitor, PP2, abrogates both ER stress–induced Src phosphorylation and EMT. Whether TN or TG directly activate Src independent of UPR activation, and mechanisms whereby ER stress lead to Src phosphorylation, are as yet undefined.
Similar articles
- Alveolar epithelial cells undergo epithelial-to-mesenchymal transition in response to endoplasmic reticulum stress.
Tanjore H, Cheng DS, Degryse AL, Zoz DF, Abdolrasulnia R, Lawson WE, Blackwell TS. Tanjore H, et al. J Biol Chem. 2011 Sep 2;286(35):30972-30980. doi: 10.1074/jbc.M110.181164. Epub 2011 Jul 11. J Biol Chem. 2011. PMID: 21757695 Free PMC article. - Induction of epithelial-mesenchymal transition in alveolar epithelial cells by transforming growth factor-beta1: potential role in idiopathic pulmonary fibrosis.
Willis BC, Liebler JM, Luby-Phelps K, Nicholson AG, Crandall ED, du Bois RM, Borok Z. Willis BC, et al. Am J Pathol. 2005 May;166(5):1321-32. doi: 10.1016/s0002-9440(10)62351-6. Am J Pathol. 2005. PMID: 15855634 Free PMC article. - Detection of epithelial to mesenchymal transition in airways of a bleomycin induced pulmonary fibrosis model derived from an alpha-smooth muscle actin-Cre transgenic mouse.
Wu Z, Yang L, Cai L, Zhang M, Cheng X, Yang X, Xu J. Wu Z, et al. Respir Res. 2007 Jan 7;8(1):1. doi: 10.1186/1465-9921-8-1. Respir Res. 2007. PMID: 17207287 Free PMC article. - Emerging evidence for endoplasmic reticulum stress in the pathogenesis of idiopathic pulmonary fibrosis.
Tanjore H, Blackwell TS, Lawson WE. Tanjore H, et al. Am J Physiol Lung Cell Mol Physiol. 2012 Apr 15;302(8):L721-9. doi: 10.1152/ajplung.00410.2011. Epub 2012 Jan 27. Am J Physiol Lung Cell Mol Physiol. 2012. PMID: 22287606 Free PMC article. Review. - Endoplasmic reticulum stress in pulmonary fibrosis.
Burman A, Tanjore H, Blackwell TS. Burman A, et al. Matrix Biol. 2018 Aug;68-69:355-365. doi: 10.1016/j.matbio.2018.03.015. Epub 2018 Mar 19. Matrix Biol. 2018. PMID: 29567124 Free PMC article. Review.
Cited by
- Endogenous Anti-Cancer Candidates in GPCR, ER Stress, and EMT.
Gundamaraju R, Lu W, Azimi I, Eri R, Sohal SS. Gundamaraju R, et al. Biomedicines. 2020 Oct 9;8(10):402. doi: 10.3390/biomedicines8100402. Biomedicines. 2020. PMID: 33050301 Free PMC article. Review. - Modulating the alveolar milieu to enhance resolution of fibrotic lung injury.
Garcia O, Buckley S, Navarro S, Driscoll B, Warburton D. Garcia O, et al. Proc Am Thorac Soc. 2012 Jul;9(3):117-9. doi: 10.1513/pats.201201-013AW. Proc Am Thorac Soc. 2012. PMID: 22802284 Free PMC article. - ER Stress is Involved in Epithelial-To-Mesenchymal Transition of Alveolar Epithelial Cells Exposed to a Hypoxic Microenvironment.
Delbrel E, Uzunhan Y, Soumare A, Gille T, Marchant D, Planès C, Boncoeur E. Delbrel E, et al. Int J Mol Sci. 2019 Mar 14;20(6):1299. doi: 10.3390/ijms20061299. Int J Mol Sci. 2019. PMID: 30875855 Free PMC article. - Valosin-Containing Protein, a Calcium-Associated ATPase Protein, in Endoplasmic Reticulum and Mitochondrial Function and Its Implications for Diseases.
Sun X, Qiu H. Sun X, et al. Int J Mol Sci. 2020 May 28;21(11):3842. doi: 10.3390/ijms21113842. Int J Mol Sci. 2020. PMID: 32481679 Free PMC article. Review. - Epithelial-mesenchymal transition induces endoplasmic-reticulum-stress response in human colorectal tumor cells.
Zeindl-Eberhart E, Brandl L, Liebmann S, Ormanns S, Scheel SK, Brabletz T, Kirchner T, Jung A. Zeindl-Eberhart E, et al. PLoS One. 2014 Jan 31;9(1):e87386. doi: 10.1371/journal.pone.0087386. eCollection 2014. PLoS One. 2014. PMID: 24498091 Free PMC article.
References
- Pardo A, Selman M. Idiopathic pulmonary fibrosis: new insights in its pathogenesis. Int J Biochem Cell Biol 2002;3:1534–1538 - PubMed
- American Thoracic Society/European Respiratory Society International Multidisciplinary Consensus Classification of the Idiopathic Interstitial Pneumonias This joint statement of the American Thoracic Society (ATS), and the European Respiratory Society (ERS) was adopted by the ATS Board of Directors, June 2001 and by the ERS Executive Committee, June 2001. Am J Respir Crit Care Med 2002;165:277–304 - PubMed
- Noble PW, Homer RJ. Back to the future: historical perspective on the pathogenesis of idiopathic pulmonary fibrosis. Am J Respir Cell Mol Biol 2005;33:113–120 - PubMed
- Selman M, King TE, Pardo A. Idiopathic pulmonary fibrosis: prevailing and evolving hypotheses about its pathogenesis and implications for therapy. Ann Intern Med 2001;134:136–151 - PubMed
Publication types
MeSH terms
Substances
Grants and funding
- DE014183/DE/NIDCR NIH HHS/United States
- R01 HL062569/HL/NHLBI NIH HHS/United States
- HL038621/HL/NHLBI NIH HHS/United States
- R01 HL089445/HL/NHLBI NIH HHS/United States
- R01 HL038621/HL/NHLBI NIH HHS/United States
- R01 ES017034/ES/NIEHS NIH HHS/United States
- HL062569/HL/NHLBI NIH HHS/United States
- R01 HL095349/HL/NHLBI NIH HHS/United States
- R37 HL062569/HL/NHLBI NIH HHS/United States
- RC2 ES018782/ES/NIEHS NIH HHS/United States
- ES018782/ES/NIEHS NIH HHS/United States
- R01 DE014183/DE/NIDCR NIH HHS/United States
- HL019737/HL/NHLBI NIH HHS/United States
- R01 HL038578/HL/NHLBI NIH HHS/United States
- HL089445/HL/NHLBI NIH HHS/United States
- DE010742/DE/NIDCR NIH HHS/United States
- HL056590/HL/NHLBI NIH HHS/United States
- P01 HL019737/HL/NHLBI NIH HHS/United States
- HL095349/HL/NHLBI NIH HHS/United States
- R01 DE010742/DE/NIDCR NIH HHS/United States
- R01 HL056590/HL/NHLBI NIH HHS/United States
- HL038578/HL/NHLBI NIH HHS/United States
- ES017034/ES/NIEHS NIH HHS/United States
LinkOut - more resources
Full Text Sources
Other Literature Sources
Research Materials
Miscellaneous
