Histone deacetylases suppress CGG repeat-induced neurodegeneration via transcriptional silencing in models of fragile X tremor ataxia syndrome - PubMed (original) (raw)
Histone deacetylases suppress CGG repeat-induced neurodegeneration via transcriptional silencing in models of fragile X tremor ataxia syndrome
Peter K Todd et al. PLoS Genet. 2010.
Abstract
Fragile X Tremor Ataxia Syndrome (FXTAS) is a common inherited neurodegenerative disorder caused by expansion of a CGG trinucleotide repeat in the 5'UTR of the fragile X syndrome (FXS) gene, FMR1. The expanded CGG repeat is thought to induce toxicity as RNA, and in FXTAS patients mRNA levels for FMR1 are markedly increased. Despite the critical role of FMR1 mRNA in disease pathogenesis, the basis for the increase in FMR1 mRNA expression is unknown. Here we show that overexpressing any of three histone deacetylases (HDACs 3, 6, or 11) suppresses CGG repeat-induced neurodegeneration in a Drosophila model of FXTAS. This suppression results from selective transcriptional repression of the CGG repeat-containing transgene. These findings led us to evaluate the acetylation state of histones at the human FMR1 locus. In patient-derived lymphoblasts and fibroblasts, we determined by chromatin immunoprecipitation that there is increased acetylation of histones at the FMR1 locus in pre-mutation carriers compared to control or FXS derived cell lines. These epigenetic changes correlate with elevated FMR1 mRNA expression in pre-mutation cell lines. Consistent with this finding, histone acetyltransferase (HAT) inhibitors repress FMR1 mRNA expression to control levels in pre-mutation carrier cell lines and extend lifespan in CGG repeat-expressing Drosophila. These findings support a disease model whereby the CGG repeat expansion in FXTAS promotes chromatin remodeling in cis, which in turn increases expression of the toxic FMR1 mRNA. Moreover, these results provide proof of principle that HAT inhibitors or HDAC activators might be used to selectively repress transcription at the FMR1 locus.
Conflict of interest statement
Dr Nicholas A. Di Prospero is a current employee of Johnson and Johnson Pharmaceutical Research and Development.
Figures
Figure 1. HDAC6 suppresses (CGG)90-eGFP–induced neurodegeneration by an autophagy independent mechanism.
Expression of eGFP alone in the fly eye with a gmr-GAL4 driver has no notable phenotype (A). When a CGG repeat is placed in the 5′UTR of eGFP, a dose- and temperature-dependent rough eye phenotype develops that is more severe in line 1 (B) than line 2 (E). The severe rough eye phenotype is suppressed by co-expression of HDAC6(C). This phenotypic rescue by HDAC6 does not depend on an intact autophagy pathway, as siRNA-based knockdown of atg12 does not prevent suppression (D). The mild rough eye phenotype seen in line 2 is synergistically enhanced by siRNA-based knockdown of dHDAC6, producing a black necrotic eschar on portions of the eye(F). Of note, dHDAC6 knockdown induces a mild rough eye phenotype when expressed alone (G). As a negative control, expression of Beta-Gal (lacZ) has no effect on the phenotype. (H). All images are representative of >100 flies per genotype and at least two separate crosses. KD = knock down.
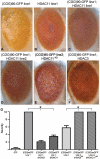
Figure 2. HDAC3 and HDAC11 also suppress (CGG)90-eGFP mRNA–induced neurodegeneration.
Co-expression of HDAC11, a class IV HDAC and HDAC6 interacting partner, suppresses (CGG)90-eGFP induced neurodegeneration similarly to HDAC6 in either of two HDAC11-expressing lines (C and D compared to A). Overexpression of HDAC11 alone had no phenotype (B). Lowering endogenous dHDAC11 by siRNA significantly enhances (CGG)90-eGFP induced neurodegeneration (2E versus 1E). Similarly, overexpression of HDAC3, a class I HDAC, suppresses the (CGG)90-eGFP phenotype (F). G) Quantitation of the phenotypes in Figure 1 and Figure 2. Analysis of ∼20 flies per genotype demonstrates highly significant alterations in the phenotype. * represents P<0.01 by a Students' unpaired t-test. The lack of error bars on (CGG)90-eGFP line 1 and (CGG)90-eGFP line 2 co-expressed with siRNAs against HDAC6 and 11 reflect the fact that all observed flies had the most severe phenotype score.
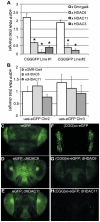
Figure 3. HDAC over-expression suppresses the accumulation of (CGG)90-eGFP mRNA.
A) RT-PCR performed on total RNA isolated from the heads of flies with the noted genotypes. eGFP mRNA expression was normalized to18S RNA and expressed as fold change compared to uas-eGFP (Chr2) x gmr-Gal4 alone. (CGG)90-eGFP transcript levels for both line 1 and line 2 are significantly decreased when any of 3 classes of HDACs is co-expressed, compared to either line of (CGG)90-eGFP crossed with the gmr-Gal4 driver line alone. B) In contrast, there are no significant changes in eGFP mRNA levels when HDAC6 or HDAC11 is co-expressed with either of 2 uas–eGFP lines with different chromosomal insertion sites. Data represent the summary of 3 independent experiments with n>10 for each genotype. (C–H) eGFP protein expression in fly lines was visualized by fluorescence. Co-expression of HDAC6 (D) or HDAC11 (E) with eGFP leads to little or no decrease in fluorescent signal. In contrast, eGFP protein expression in (CGG)90-eGFP flies (F) is markedly reduced by co-expression of HDAC6 (G) or HDAC11 (H). * = P<0.01 versus (CGG)90-eGFP alone by a Students unpaired t-test.
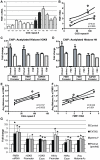
Figure 4. Chromatin alterations at FMR1 locus in pre-mutation expansion carrier lymphoblasts.
A) FMR1 mRNA expression by qRT-PCR from 13 lymphoblastoid cell lines derived from male patients in fragile X families. FMR1 mRNA levels, normalized to actin mRNA, are expressed relative to a control cell line included in all experiments ((CGG)41). White bars = control cell lines. Black bars = confirmed FXTAS cases. Light grey bars = pre-mutation carriers whose clinical status is unknown. B) Correlation between CGG repeat size and FMR1 mRNA. Solid black dots = control cell lines, stars = confirmed FXTAS cases, open circles = pre-mutation carriers whose clinical status is unknown. The central line is the linear best fit. Curved dashed lines are 95% confidence intervals. The correlation is significant (Spearman correlation r2 = 0.515, p = 0.005). C) ChIP against acetylated Histone H3K9 from all pre-mutation carriers (FXTAS and unknown clinical status, dark gray bars), controls (white bars), or FXS (spotted bars, 1 cell line) patient-derived cell lines. PCR primers were targeted to the FMR1 promoter, the first exon of FMR1, or the GAPDH promoter as a control. D) ChIP against acetylated Histone H4. For (C) and (D), ChIP DNA expression is normalized to input DNA and then graphed as fold change from a control cell line included in all experiments. E) Correlation between CGG repeat length and H3/H4 acetylation status. Repeat length plotted against mean fold change for association of the FMR1 locus with H3K9 or H4 acetylated histones. A combination of both markers at both the promoter and exon provided the best fit model. F) Correlation between H3/H4 histone acetylation and FMR1 mRNA levels. G) Comparison of confirmed FXTAS cases (black bars, n = 2) and pre-mutation lines whose clinical status is unknown (light grey bars, n = 4) with controls (white bars, n = 7). Dark grey bars = Pooled data on all pre-mutation lines (n = 6). * = P<0.05 t-test vs controls.
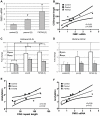
Figure 5. Chromatin alterations at the FMR1 locus in FXTAS patient derived fibroblasts.
A) FMR1 mRNA expression in fibroblast cell lines quantified by qRT-PCR, normalized to actin and expressed as fold change from the mean of 3 control cell lines. We used 3 control cell lines (C1(CGG)31, C4(CGG)22 and C5(CGG)30) 3 asymptomatic pre-mutation carrier lines (P3(CGG)81, P4(CGG)70 and P5(CGG)67) and 3 cell lines from FXTAS patients (F1(CGG)122, F2(CGG105 and F3(CGG)97). * = p<0.05 compared to controls. B) Correlation of CGG repeat length and FMR1 mRNA expression. Black dots represent controls, open circles represent asymptomatic pre-mutation carriers, stars represent FXTAS patient-derived cell lines. Straight line reflects best fit and curved lines represent 95% confidence intervals. The correlation is significant (r2 = 0.584, p = 0.016). C) ChIP performed on fibroblasts using antibody to Acetylated H3K9. White bars represent primers directed against the FMR1 promoter, Gray bars against FMR1 exon 1. Results are normalized to mean value of the control cell lines and expressed as fold change from this cell line. * = p<0.05 of averaged FMR1 levels from the promoter and exon versus controls. D) ChIP performed on fibroblasts using an antibody directed against Acetylated Histone H4. Pooled analysis grouping of all pre-mutation carrier-derived cell lines was significant for either AcH3K9 alone or a pooled analysis of both (AcH3K9, p = 0.02; AcH4+AcH3K9, p = 0.008), unpaired Students t-test). E) Correlation of CGG repeat number to histone acetylation (r2 = 0.44, p = 0.05). F) Correlation of FMR1 mRNA expression and histone acetylation at the FMR1 locus was significant (r2 = 0.582, p = 0.016). Data from individual cell line ChIP experiments are shown in Figure S6.
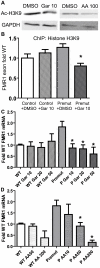
Figure 6. Correction of elevated FMR1 mRNA expression by treatment with histone acetyltransferase inhibitors.
A) Pre-mutation carrier derived lymphoblastoid cell lines treated with DMSO, 10 µM garcinol, or 50 µM anacardic acid, for 24 hours are subjected to western blot for Acetyl-Histone H3-K9. GAPDH is shown as a loading control. B) Garcinol decreases chromatin acetylation at the FMR1 locus selectively in pre-mutation carrier derived cells. Control (C0038.026; (CGG)30) or FXTAS patient-derived lymphoblast cells (C014.004; (CGG)91) were treated for 24 hours with either 10 µM garcinol or DMSO and subjected to ChIP with acetyl-H3K9 antibodies. Data is expressed as fold change from WT cells treated with DMSO and is a summary of 4 independent experiments. C) Garcinol selectively decreases FMR1 RNA expression in pre-mutation carrier derived cells. The cell lines described in (B) were treated with either DMSO or garcinol at the described doses (in µM) for 24 hours, followed by RNA isolation and qRT-PCR. D) Anacardic acid selectively decreases FMR1 mRNA expression in pre-mutation carrier derived cells. The cell lines described in (B) were treated with either DMSO or Anacardic acid at the specified doses (in µM) for 24 hours and then processed as in (C). For both (C) and (D), FMR1 mRNA levels were normalized to 18S RNA and expressed as fold change from DMSO treated control cells. The data in (C) and (D) are a summary of 3 independent experiments. For all panels, * represents a p<0.05 on paired Students t-test compared to pre-mutation carrier derived cells treated with DMSO.
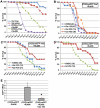
Figure 7. HAT inhibitors extend lifespan in adult (CGG)90-eGFP flies.
A) young (1–3 days post eclosion) adult (CGG)90eGFP line 1or line 2 flies co-expressing a Tubulin Geneswitch driver were transferred to tubes containing normal fly food (blue line), food containing 400 µM Garcinol (red line), or food containing RU486 to activate expression of the ubiquitous driver (Line 1, purple line, Line 2 green line). Data is expressed as % survival over days and represents a summary of two independent experiments. B) For (CGG)90eGFP line 1, addition of Garcinol to the food containing RU486 led to a dose dependent increase in lifespan (purple = RU486+DMSO, blue = RU486+Gar 100 µM, orange = RU486+Gar 200 µM, red = RU486+Gar 400 µM, Log Rank test for trend, p<0.0001). C) Similarly, for (CGG)90eGFP line 2, addition of Garcinol to the food containing RU486 led to a dose dependent increase in lifespan, with many flies at the highest dose surviving beyond the end of the study (green = RU486+DMSO, blue = RU486+Gar 200 µM, red = RU486+Gar 400 µM, Log Rank test (Mantel-Cox), p<0.0001). D) There was also a significant extension of lifespan with addition of Anacardic Acid (250 µM) to the food of (CGG)90eGFP line 2 flies (green = RU486+DMSO, red = RU486+AA 250 µM, Log Rank test (Mantel-Cox), p<0.0001). E) (CGG)90eGFP mRNA expression was significantly induced after feeding the flies food containing RU486 for 72 hours. This RU486 activated (CGG)90eGFP mRNA expression was suppressed by co-treatment with 400 µM Garcinol (* = paired Students t-test, p<0.01). Data presented are the summary of two independent experiments with n = 10 flies per group for each study. (CGG)90eGFP mRNA is quantified in arbitrary units on the y axis.
Similar articles
- FMR1 CGG repeat lengths mediate different regulation of reporter gene expression in comparative transient and locus specific integration assays.
Sølvsten C, Nielsen AL. Sølvsten C, et al. Gene. 2011 Oct 15;486(1-2):15-22. doi: 10.1016/j.gene.2011.06.034. Epub 2011 Jul 13. Gene. 2011. PMID: 21767618 - CNS expression of murine fragile X protein (FMRP) as a function of CGG-repeat size.
Ludwig AL, Espinal GM, Pretto DI, Jamal AL, Arque G, Tassone F, Berman RF, Hagerman PJ. Ludwig AL, et al. Hum Mol Genet. 2014 Jun 15;23(12):3228-38. doi: 10.1093/hmg/ddu032. Epub 2014 Jan 23. Hum Mol Genet. 2014. PMID: 24463622 Free PMC article. - RAN translation at CGG repeats induces ubiquitin proteasome system impairment in models of fragile X-associated tremor ataxia syndrome.
Oh SY, He F, Krans A, Frazer M, Taylor JP, Paulson HL, Todd PK. Oh SY, et al. Hum Mol Genet. 2015 Aug 1;24(15):4317-26. doi: 10.1093/hmg/ddv165. Epub 2015 May 7. Hum Mol Genet. 2015. PMID: 25954027 Free PMC article. - [Chromatin changes caused by CGG repeat expansion in fmr1 gene].
Yudkin DV, Lemskaya NA, Grischenko IV, Dolskiy AA. Yudkin DV, et al. Mol Biol (Mosk). 2015 Mar-Apr;49(2):205-11. Mol Biol (Mosk). 2015. PMID: 26065250 Review. Russian. - [FMR1 PREMUTATION CARRIERS - ARE THEY REALLY ASYMPTOMATIC?].
Elizur S, Berkenstadt M, Ries-Levavi L, Gruber N, Pinhas-Hamiel O, Hassin-Baer S, Raas-Rothschild A, Raanani H, Cukierman-Yaffe T, Orvieto R, Cohen Y, Gabis L. Elizur S, et al. Harefuah. 2018 Apr;157(4):241-244. Harefuah. 2018. PMID: 29688643 Review. Hebrew.
Cited by
- The promise and perils of HDAC inhibitors in neurodegeneration.
Didonna A, Opal P. Didonna A, et al. Ann Clin Transl Neurol. 2015 Jan;2(1):79-101. doi: 10.1002/acn3.147. Epub 2014 Dec 3. Ann Clin Transl Neurol. 2015. PMID: 25642438 Free PMC article. Review. - Repeat-mediated epigenetic dysregulation of the FMR1 gene in the fragile X-related disorders.
Usdin K, Kumari D. Usdin K, et al. Front Genet. 2015 Jun 3;6:192. doi: 10.3389/fgene.2015.00192. eCollection 2015. Front Genet. 2015. PMID: 26089834 Free PMC article. Review. - Repeat-associated non-AUG (RAN) translation and other molecular mechanisms in Fragile X Tremor Ataxia Syndrome.
Glineburg MR, Todd PK, Charlet-Berguerand N, Sellier C. Glineburg MR, et al. Brain Res. 2018 Aug 15;1693(Pt A):43-54. doi: 10.1016/j.brainres.2018.02.006. Epub 2018 Feb 14. Brain Res. 2018. PMID: 29453961 Free PMC article. Review. - The carboxyl termini of RAN translated GGGGCC nucleotide repeat expansions modulate toxicity in models of ALS/FTD.
He F, Flores BN, Krans A, Frazer M, Natla S, Niraula S, Adefioye O, Barmada SJ, Todd PK. He F, et al. Acta Neuropathol Commun. 2020 Aug 4;8(1):122. doi: 10.1186/s40478-020-01002-8. Acta Neuropathol Commun. 2020. PMID: 32753055 Free PMC article. - Long Noncoding RNA Can Be a Probable Mechanism and a Novel Target for Diagnosis and Therapy in Fragile X Syndrome.
Huang G, Zhu H, Wu S, Cui M, Xu T. Huang G, et al. Front Genet. 2019 May 22;10:446. doi: 10.3389/fgene.2019.00446. eCollection 2019. Front Genet. 2019. PMID: 31191598 Free PMC article. Review.
References
- Jacquemont S, Hagerman RJ, Leehey MA, Hall DA, Levine RA, et al. Penetrance of the fragile X-associated tremor/ataxia syndrome in a premutation carrier population. JAMA. 2004;291:460–469. - PubMed
- Greco CM, Berman RF, Martin RM, Tassone F, Schwartz PH, et al. Neuropathology of fragile X-associated tremor/ataxia syndrome (FXTAS). Brain. 2006;129:243–255. - PubMed
- Greco CM, Hagerman RJ, Tassone F, Chudley AE, Del Bigio MR, et al. Neuronal intranuclear inclusions in a new cerebellar tremor/ataxia syndrome among fragile X carriers. Brain. 2002;125:1760–1771. - PubMed
Publication types
MeSH terms
Substances
Grants and funding
- NS053825/NS/NINDS NIH HHS/United States
- NS069809/NS/NINDS NIH HHS/United States
- R01 NS053825/NS/NINDS NIH HHS/United States
- NS038712/NS/NINDS NIH HHS/United States
- R01 NS038712/NS/NINDS NIH HHS/United States
- K08 NS069809/NS/NINDS NIH HHS/United States
LinkOut - more resources
Full Text Sources
Other Literature Sources
Medical
Molecular Biology Databases

