Hemodynamic patterning of the avian atrioventricular valve - PubMed (original) (raw)
Hemodynamic patterning of the avian atrioventricular valve
Huseyin C Yalcin et al. Dev Dyn. 2011 Jan.
Abstract
In this study, we develop an innovative approach to rigorously quantify the evolving hemodynamic environment of the atrioventricular (AV) canal of avian embryos. Ultrasound generated velocity profiles were imported into Micro-Computed Tomography generated anatomically precise cardiac geometries between Hamburger-Hamilton (HH) stages 17 and 30. Computational fluid dynamic simulations were then conducted and iterated until results mimicked in vivo observations. Blood flow in tubular hearts (HH17) was laminar with parallel streamlines, but strong vortices developed simultaneous with expansion of the cushions and septal walls. For all investigated stages, highest wall shear stresses (WSS) are localized to AV canal valve-forming regions. Peak WSS increased from 19.34 dynes/cm(2) at HH17 to 287.18 dynes/cm(2) at HH30, but spatiotemporally averaged WSS became 3.62 dynes/cm(2) for HH17 to 9.11 dynes/cm(2) for HH30. Hemodynamic changes often preceded and correlated with morphological changes. These results establish a quantitative baseline supporting future hemodynamic analyses and interpretations.
© 2010 Wiley-Liss, Inc.
Figures
Fig. 1
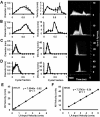
Stage specific AV orifice diameter (left) and peak velocity (right) as measured by ultrasound. Insets on right are representative original Doppler velocity recordings. A: HH17. B: HH23. C: HH 27. D: HH 30. Correlation of AV canal velocity with left atrial (LA) input velocity for stages E: HH27 and F: HH30.
Fig. 2
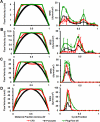
Stage specific AV orifice flow profiles at peak velocity (left) and spatially averaged WSS throughout cardiac cycle (right) as calculated by CFD and from ultrasound with Poiseuille and Plug Flow (boundary layer 1/5th of the diameter) assumptions. A: HH17. B: HH23. C: HH 27. D: HH 30.
Fig. 3
Change in pressure across the AV canal region.
Fig. 4
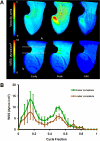
A: 3D hemodynamic environment in the AV region - Stage HH 17. B: Spatially averaged WSS on the inner curvature versus outer curvature throughout the cardiac cycle. A is atria V is ventricle.
Fig. 5
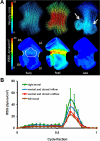
A: 3D hemodynamic environment in the AV region - Stage HH 23. Arrows at late cycle representation show location of vortices. B: Spatially averaged WSS on the right and left mural surfaces and ventral and dorsal midlines throughout cardiac cycle. RA is right atria, LA is left atria, RV is right ventricle, LV is left ventricle.
Fig. 6
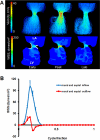
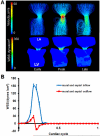
A: 3D hemodynamic environment in the AV region - Stage HH 27. B: Spatially averaged WSS on the inflow and outflow surfaces throughout cardiac cycle. LA is left atria, LV is left ventricle.
Fig. 7
A: 3D hemodynamic environment in the AV region - Stage HH 30. B: Spatially averaged WSS on the inflow and outflow surfaces throughout cardiac cycle. LA is left atria, LV is left ventricle.
Fig. 8
Stage dependent blood rheology. A: Hematocrit amounts for stages (adapted from (RYCHTER et al., 1955)). B: Hematocrit dependent blood density (Adapted from (Usami et al., 1970)). C: Nonlinear power law relationship for shear-rate dependent viscosity. Dots represent correlations generated based on hematocrit amounts and lines based on embryonic stages.
Fig. 9
Cushion regions where the WSS were traced (shown with dotted lines). Inflow segments are blue, outflow are red for seperated regions. Trace colors match with plot colors for regions in Figures 4–7. At HH24, dorsal cushion is on the other side of the geometry. A is atria, V is ventricle, L is left, R is right.
Similar articles
- Computational fluid dynamics of developing avian outflow tract heart valves.
Bharadwaj KN, Spitz C, Shekhar A, Yalcin HC, Butcher JT. Bharadwaj KN, et al. Ann Biomed Eng. 2012 Oct;40(10):2212-27. doi: 10.1007/s10439-012-0574-8. Epub 2012 Apr 26. Ann Biomed Eng. 2012. PMID: 22535311 Free PMC article. - Effect of left atrial ligation-driven altered inflow hemodynamics on embryonic heart development: clues for prenatal progression of hypoplastic left heart syndrome.
Salman HE, Alser M, Shekhar A, Gould RA, Benslimane FM, Butcher JT, Yalcin HC. Salman HE, et al. Biomech Model Mechanobiol. 2021 Apr;20(2):733-750. doi: 10.1007/s10237-020-01413-5. Epub 2021 Jan 22. Biomech Model Mechanobiol. 2021. PMID: 33481120 Free PMC article. - Transitions in early embryonic atrioventricular valvular function correspond with changes in cushion biomechanics that are predictable by tissue composition.
Butcher JT, McQuinn TC, Sedmera D, Turner D, Markwald RR. Butcher JT, et al. Circ Res. 2007 May 25;100(10):1503-11. doi: 10.1161/CIRCRESAHA.107.148684. Epub 2007 May 3. Circ Res. 2007. PMID: 17478728 - Moving domain computational fluid dynamics to interface with an embryonic model of cardiac morphogenesis.
Lee J, Moghadam ME, Kung E, Cao H, Beebe T, Miller Y, Roman BL, Lien CL, Chi NC, Marsden AL, Hsiai TK. Lee J, et al. PLoS One. 2013 Aug 23;8(8):e72924. doi: 10.1371/journal.pone.0072924. eCollection 2013. PLoS One. 2013. PMID: 24009714 Free PMC article. - Alterations in regional vascular geometry produced by theoretical stent implantation influence distributions of wall shear stress: analysis of a curved coronary artery using 3D computational fluid dynamics modeling.
LaDisa JF Jr, Olson LE, Douglas HA, Warltier DC, Kersten JR, Pagel PS. LaDisa JF Jr, et al. Biomed Eng Online. 2006 Jun 16;5:40. doi: 10.1186/1475-925X-5-40. Biomed Eng Online. 2006. PMID: 16780592 Free PMC article.
Cited by
- Tissue clearing and imaging methods for cardiovascular development.
Kolesová H, Olejníčková V, Kvasilová A, Gregorovičová M, Sedmera D. Kolesová H, et al. iScience. 2021 Apr 1;24(4):102387. doi: 10.1016/j.isci.2021.102387. eCollection 2021 Apr 23. iScience. 2021. PMID: 33981974 Free PMC article. Review. - Quantification of embryonic atrioventricular valve biomechanics during morphogenesis.
Buskohl PR, Gould RA, Butcher JT. Buskohl PR, et al. J Biomech. 2012 Mar 15;45(5):895-902. doi: 10.1016/j.jbiomech.2011.11.032. Epub 2011 Dec 12. J Biomech. 2012. PMID: 22169154 Free PMC article. - Hemodynamics in Cardiac Development.
Poelmann RE, Gittenberger-de Groot AC. Poelmann RE, et al. J Cardiovasc Dev Dis. 2018 Nov 6;5(4):54. doi: 10.3390/jcdd5040054. J Cardiovasc Dev Dis. 2018. PMID: 30404214 Free PMC article. - Quantitative three-dimensional imaging of live avian embryonic morphogenesis via micro-computed tomography.
Henning AL, Jiang MX, Yalcin HC, Butcher JT. Henning AL, et al. Dev Dyn. 2011 Aug;240(8):1949-57. doi: 10.1002/dvdy.22694. Dev Dyn. 2011. PMID: 21761480 Free PMC article. - Desert hedgehog-primary cilia cross talk shapes mitral valve tissue by organizing smooth muscle actin.
Fulmer D, Toomer KA, Glover J, Guo L, Moore K, Moore R, Stairley R, Gensemer C, Abrol S, Rumph MK, Emetu F, Lipschutz JH, McDowell C, Bian J, Wang C, Beck T, Wessels A, Renault MA, Norris RA. Fulmer D, et al. Dev Biol. 2020 Jul 1;463(1):26-38. doi: 10.1016/j.ydbio.2020.03.003. Epub 2020 Mar 6. Dev Biol. 2020. PMID: 32151560 Free PMC article.
References
- Auerbach R, Kubai L, Knighton D, Folkman J. A simple procedure for the long-term cultivation of chicken embryos. Dev Biol. 1974;41:391–394. - PubMed
- Birchall D, Zaman A, Hacker J, Davies G, Mendelow D. Analysis of haemodynamic disturbance in the atherosclerotic carotid artery using computational fluid dynamics. Eur Radiol. 2006;16:1074–1083. - PubMed
- Butcher JT, Nerem RM. Valvular endothelial cells regulate the phenotype of interstitial cells in co-culture: effects of steady shear stress. Tissue Eng. 2006;12:905–915. - PubMed
- Butcher JT, Tressel S, Johnson T, Turner D, Sorescu G, Jo H, Nerem RM. Transcriptional profiles of valvular and vascular endothelial cells reveal phenotypic differences: Influence of shear stress. Arterioscler Thromb Vasc Biol. 2006;26:69–77. - PubMed
Publication types
MeSH terms
Grants and funding
- HL0077/HL/NHLBI NIH HHS/United States
- RR016434/RR/NCRR NIH HHS/United States
- P20 RR016434/RR/NCRR NIH HHS/United States
- HL033756/HL/NHLBI NIH HHS/United States
- R01 HL110328-01/HL/NHLBI NIH HHS/United States
- R21 HL083975/HL/NHLBI NIH HHS/United States
- R01 HL033756/HL/NHLBI NIH HHS/United States
- HL083975/HL/NHLBI NIH HHS/United States
- R01 HL110328/HL/NHLBI NIH HHS/United States
LinkOut - more resources
Full Text Sources
Research Materials
