Precise beam-tilt alignment and collimation are required to minimize the phase error associated with coma in high-resolution cryo-EM - PubMed (original) (raw)
Review
Precise beam-tilt alignment and collimation are required to minimize the phase error associated with coma in high-resolution cryo-EM
Robert M Glaeser et al. J Struct Biol. 2011 Apr.
Abstract
Electron microscopy at a resolution of 0.4nm or better requires more careful adjustment of the illumination than is the case at a resolution of 0.8nm. The use of current-axis alignment is not always sufficient, for example, to avoid the introduction of large phase errors, at higher resolution, due to axial coma. In addition, one must also ensure that off-axis coma does not corrupt the data quality at the higher resolution. We particularly emphasize that the standard CTF correction does not account for the phase error associated with coma. We explain the cause of both axial coma and the typically most troublesome component of off-axis coma in terms of the well-known shift of the electron diffraction pattern relative to the optical axis that occurs when the illumination is not parallel to the axis. We review the experimental conditions under which coma causes unacceptably large phase errors, and we discuss steps that can be taken when setting up the conditions of illumination, so as to ensure that neither axial nor off-axis coma is a problem.
Copyright © 2011 Elsevier Inc. All rights reserved.
Figures
Figure 1
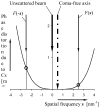
Illustration of the fact that the phase distortion function, γ(s), no longer has the same value on opposite sides of the scattered wave when the incident illumination is tilted relative to the optical axis of the objective lens. For simplicity, only the contribution from spherical aberration is shown in this figure, since – for small tilt angles – the contribution from defocus (if any) causes only a shift (displacement) of the entire image. As is shown in this figure, beam-tilt shifts the center of the diffraction pattern relative to the optical axis, thus breaking the inversion symmetry that is required in order for the image to be accurately described in terms of the familiar phase-contrast transfer function, sinγ. The curve shown here was calculated for 300 keV electrons, assuming Cs = 2.2 mm, zero defocus, and a beam tilt of 1 milli-radian.
Figure 2
Illustration of three physical effects that can cause the incident illumination to be tilted relative to the optical axis of the objective lens. A fourth effect, not shown here but explained in the text, results in an azimuthal tilt of the illumination, due to the spiral trajectories of electrons within the magnetic field of the objective lens. As is shown in the figure, the angles α and β describe the direction of a ray relative to the mid-point of a distribution; the same symbols are also used to refer to the half-angle of the distribution. (A) A given point on the specimen is illuminated by a finite “source” of electrons, i.e. the final beam crossover that is formed above the specimen. As a result, the illumination angle varies over a small range, with half-angle α. Although the necessarily finite source-size limits the spatial coherence of the illumination, it is not normally a consideration when discussing coma. (B) Assuming that the illumination can be approximated as being perfectly parallel, the direction of the beam may still be tilted by an angle, θ, relative to the optical axis. (C) Assuming that the final beam crossover can be approximated as a point source, the illumination reaching the specimen is nevertheless either a diverging spherical wave (as is shown in this panel) or a converging spherical wave. As a result, the local tilt angle, β, varies continuously over the illuminated area. As is explained in the text, the maximum value of β depends upon the position of the beam crossover relative to the front focal plane of the objective-lens “pre-field”, and β is zero only when the illumination is focused exactly onto the front focal plane of the pre-field lens.
Figure 3
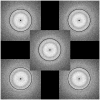
A comparison of the tableau of FFTs obtained after current-axis alignment to the tableau obtained after (nearly) coma-free alignment. (A) FFT tableau obtained after current-axis alignment. The center panel shows the FFT of an image recorded without applying an additional beam tilt, while the panels on the 4 corners show the FFTs for images recorded after applying additional beam tilts of ~ ±5 mradian in the x and y directions, respectively. The fact that the astigmatism is slightly different for “plus” versus “minus” tilt angles demonstrates that the beam direction after performing current-axis alignment (i.e. in the central panel) is not parallel to the coma-free axis. (B) FFT tableau after performing coma-free alignment, i.e. after adjusting the beam-tilt angle so as to make the defocus and astigmatism as similar as possible for symmetrical beam tilts in the x and y directions, respectively.
Figure 4
Tableau of FFTs obtained from 50.1 × 50.1 nm areas at the corners and at the center of an image recorded with a 4kx4k CCD camera. The distance between the center and any given corner image is 248 nm. Details of the conditions under which the image was recorded are given in the text. Although the image at the center of the camera is coma-free, there is still sufficient off-axis coma to produce a barely detectable difference in focus and astigmatism at the corners of the detector relative to that at the center of the detector. The off-axis coma is due in this case to the large beam-divergence angle, β, that occurs under the “standard imaging conditions” described in the text. Although the change in defocus and astigmatism at the corners of the detector is barely detectable, it is important to emphasize that detecting even this very small effect is sufficient to tell one that the underlying variation in beam tilt across the field of view produces an unacceptably large amount of off-axis coma at a resolution of 0.4 nm.
Figure 5
Graphs of the ratio, 2_Rmax_/D, of the diameter of the nearly-isoplanatic area to the diameter of the illuminated area. While it is often desirable to condense the beam to a size that is only slightly larger than the field of view recorded on the detector, 2_Rmax_/D must not be allowed to fall much below 1.0. Regions of the graph for which the ratio is less than or equal to 1 are thus shown without shading, to draw the reader’s attention to the extent to which the conditions of illumination become less and less acceptable as one varies the diameter of the illuminated area for a given size of C2 aperture. On the other hand, since values of the ratio greater than 1 imply that the diameter of the nearly-isoplanatic area is larger than that over which data can be collected (i.e. the illuminated area), this portion of the graph is shown in grey, to emphasize that the actual values of the ratio no longer matter. Nevertheless, short portions of the curves are shown in this region, just to give a feeling for their mathematical behavior. At the same time, the reader should realize that the acceptable conditions, for which the ratio is greater than 1, become increasingly restricted as the resolution increases. As an example, the curves shown here represent only the case when one is willing to accept phase errors (at a resolution of 0.4 nm) of 45 degrees at positions close to the edge of the illuminated area. (A) Microprobe mode, 300 keV. (B) Nanoprobe mode, 300 keV. (C) Microprobe mode, 120 keV. (D) Nanoprobe mode, 120 keV.
Similar articles
- Coma-corrected rapid single-particle cryo-EM data collection on the CRYO ARM 300.
Efremov RG, Stroobants A. Efremov RG, et al. Acta Crystallogr D Struct Biol. 2021 May 1;77(Pt 5):555-564. doi: 10.1107/S2059798321002151. Epub 2021 Apr 14. Acta Crystallogr D Struct Biol. 2021. PMID: 33950012 Free PMC article. - High resolution single particle cryo-electron microscopy using beam-image shift.
Cheng A, Eng ET, Alink L, Rice WJ, Jordan KD, Kim LY, Potter CS, Carragher B. Cheng A, et al. J Struct Biol. 2018 Nov;204(2):270-275. doi: 10.1016/j.jsb.2018.07.015. Epub 2018 Jul 25. J Struct Biol. 2018. PMID: 30055234 Free PMC article. - High-quality, high-throughput cryo-electron microscopy data collection via beam tilt and astigmatism-free beam-image shift.
Wu C, Huang X, Cheng J, Zhu D, Zhang X. Wu C, et al. J Struct Biol. 2019 Dec 1;208(3):107396. doi: 10.1016/j.jsb.2019.09.013. Epub 2019 Sep 25. J Struct Biol. 2019. PMID: 31562921 - Limiting factors in atomic resolution cryo electron microscopy: no simple tricks.
Zhang X, Zhou ZH. Zhang X, et al. J Struct Biol. 2011 Sep;175(3):253-63. doi: 10.1016/j.jsb.2011.05.004. Epub 2011 May 24. J Struct Biol. 2011. PMID: 21627992 Free PMC article. Review. - Challenges and opportunities in cryo-EM with phase plate.
Wang HW, Fan X. Wang HW, et al. Curr Opin Struct Biol. 2019 Oct;58:175-182. doi: 10.1016/j.sbi.2019.06.013. Epub 2019 Jul 30. Curr Opin Struct Biol. 2019. PMID: 31374473 Review.
Cited by
- De novo modeling of the F(420)-reducing [NiFe]-hydrogenase from a methanogenic archaeon by cryo-electron microscopy.
Mills DJ, Vitt S, Strauss M, Shima S, Vonck J. Mills DJ, et al. Elife. 2013 Mar 5;2:e00218. doi: 10.7554/eLife.00218. Elife. 2013. PMID: 23483797 Free PMC article. - Experimental evaluation of super-resolution imaging and magnification choice in single-particle cryo-EM.
Feathers JR, Spoth KA, Fromme JC. Feathers JR, et al. J Struct Biol X. 2021 Mar 13;5:100047. doi: 10.1016/j.yjsbx.2021.100047. eCollection 2021. J Struct Biol X. 2021. PMID: 33817625 Free PMC article. - Influence of electron dose rate on electron counting images recorded with the K2 camera.
Li X, Zheng SQ, Egami K, Agard DA, Cheng Y. Li X, et al. J Struct Biol. 2013 Nov;184(2):251-60. doi: 10.1016/j.jsb.2013.08.005. Epub 2013 Aug 20. J Struct Biol. 2013. PMID: 23968652 Free PMC article. - High-resolution single-particle imaging at 100-200 keV with the Gatan Alpine direct electron detector.
Chan LM, Courteau BJ, Maker A, Wu M, Basanta B, Mehmood H, Bulkley D, Joyce D, Lee BC, Mick S, Czarnik C, Gulati S, Lander GC, Verba KA. Chan LM, et al. J Struct Biol. 2024 Sep;216(3):108108. doi: 10.1016/j.jsb.2024.108108. Epub 2024 Jun 27. J Struct Biol. 2024. PMID: 38944401 Free PMC article. - Characterizing the resolution and throughput of the Apollo direct electron detector.
Peng R, Fu X, Mendez JH, Randolph PS, Bammes BE, Stagg SM. Peng R, et al. J Struct Biol X. 2022 Dec 5;7:100080. doi: 10.1016/j.yjsbx.2022.100080. eCollection 2023. J Struct Biol X. 2022. PMID: 36578473 Free PMC article.
References
- Chen JZ, Settembre EC, Aoki ST, Zhang X, Bellamy AR, Dormitzer PR, Harrison SC, Grigorieff N. Molecular interactions in rotavirus assembly and uncoating seen by high-resolution cryo-EM. Proceedings of the National Academy of Sciences of the United States of America. 2009;106:10644–10648. - PMC - PubMed
- Christenson KK, Eades JA. On parallel illumination in the transmission electron microscope. Ultramicroscopy. 1986;19:191–194.
- Christenson KK, Eades JA. Skew thoughts on parallelism. Ultramicroscopy. 1988;26:113–132.
- Cong Y, Baker ML, Jakana J, Woolford D, Miller EJ, Reissmann S, Kumar RN, Redding-Johanson AM, Batth TS, Mukhopadhyay A, Ludtke SJ, Frydman J, Chiu W. 4.0-angstrom resolution cryo-EM structure of the mammalian chaperonin TRiC/CCT reveals its unique subunit arrangement. Proceedings of the National Academy of Sciences of the United States of America. 2010;107:4967–4972. - PMC - PubMed
- Eades A. Obtaining TEM images with a uniform deviation parameter. Ultramicroscopy. 2006;106:432–438. - PubMed
Publication types
MeSH terms
Grants and funding
- P41 RR017573-09/RR/NCRR NIH HHS/United States
- GM083039/GM/NIGMS NIH HHS/United States
- R01 GM083039/GM/NIGMS NIH HHS/United States
- P41 RR017573/RR/NCRR NIH HHS/United States
- P41 RR017573-08/RR/NCRR NIH HHS/United States
- R01 GM083039-03/GM/NIGMS NIH HHS/United States
- RR175732/RR/NCRR NIH HHS/United States
LinkOut - more resources
Full Text Sources
Other Literature Sources


