Autophagy regulates endoplasmic reticulum homeostasis and calcium mobilization in T lymphocytes - PubMed (original) (raw)
Autophagy regulates endoplasmic reticulum homeostasis and calcium mobilization in T lymphocytes
Wei Jia et al. J Immunol. 2011.
Abstract
Macroautophagy (hereafter referred to as autophagy) is an evolutionarily conserved intracellular bulk degradation pathway that plays critical roles in eliminating intracellular pathogens, presenting endogenous Ags, and regulating T lymphocyte survival and proliferation. In this study, we have investigated the role of autophagy in regulating the endoplasmic reticulum (ER) compartment in T lymphocytes. We found that ER content is expanded in mature autophagy-related protein (Atg) 7-deficient T lymphocytes. Atg7-deficient T cells stimulated through the TCR display impaired influx, but not efflux, of calcium, and ER calcium stores are increased in Atg7-deficient T cells. Treatment with the ER sarco/ER Ca(2+)-ATPase pump inhibitor thapsigargin rescues the calcium influx defect in Atg7-deficient T lymphocytes, suggesting that this impairment is caused by an intrinsic defect in ER. Furthermore, we found that the stimulation-induced redistribution of stromal interaction molecule-1, a critical event for the store-operated Ca(2+) release-activated Ca(2+) channel opening, is impaired in Atg7-deficient T cells. Together, these findings indicate that the expanded ER compartment in Atg7-deficient T cells contains increased calcium stores, and the inability of these stores to be depleted causes defective calcium influx in these cells. Our results demonstrate that autophagy plays an important role in maintaining ER and calcium homeostasis in T lymphocytes.
Conflict of interest statement
Conflict of interest: The authors declare no financial or commercial conflict of interest.
Figures
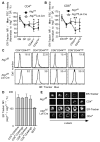
FIGURE 1. Expanded ER in autophagy-deficient mature T lymphocytes
(A, B). ER content in developing T lymphocytes from Atg7f/fLck-Cre and Atg7f/f mice. Thymocytes and splenocytes from three pairs of mice were loaded with ER-Tracker Blue-White DPX (ER-Tracker). Cells were washed, thymocytes were stained with anti-CD4-FITC and anti-CD8-PE antibodies, and splenocytes were stained with anti-CD44-FITC and either anti-CD4-PE or anti-CD8-PE antibodies. All samples were gated on 7-AAD negative live cells. To determine ER content, the mean fluorescence intensity (MFI) of ER-Tracker was divided by the mean forward scatter intensity for each population. ER content for each population was then normalized to ER content in wildtype DP thymocytes. Gates were defined as follows: DN thymocytes, CD4- CD8-; DP thymocytes, CD4+ CD8+; CD4 SP thymocytes, CD4+ CD8-; and CD8 SP thymocytes, CD4- CD8+. The mean and standard deviation (SD) are showed in the figure, *p=0.006 for CD4+ CD44low, **p=0.04 for CD8+ CD44low). (C). Representative FACS profiles showing ER-Tracker staining in mature T cells. Numbers represent MFI for each cell population. (D). The ratio of ER Tracker MFIs in Atg7-deficient cell populations to those in corresponding wild type cell populations. B220+ cells were used as a negative control. The mean and SD are showed in the figure. Data shown in Figure 1A-D were obtained from three pairs of Atg7f/fLck-Cre and Atg7f/f (wildtype) mice. (E). Fluorescent imaging of ER tracker staining in Atg7-deficient and control CD4+ T cells. The z-stack pictures were 1.2μm apart and using 63x oil object.
FIGURE 2. Increased expression of ER stress markers in Atg7-deficient T cells
(A). Representative EM images of naïve Atg7-deficient and wildtype CD4+ T cells (left two panels) and quantification of membrane structures in EM images (right panel figure). Each cell was divided into 12 equal sections based on the face of a clock. Membrane scores were defined as the number of sections per cell containing membrane structure(s). The bar figure are mean and SD (*n=50, p=3.23×10⁻⁷ for CD4 cells and **n=45, p=2.63×10⁻¹⁹ for CD8 cells). (B). Calnexin protein expression in purified total T cells from Atg7f/fLck-Cre and Atg7f/f mice was analyzed by Western blot. Numbers represent the ratios of intensity of calnexin bands to actin bands (upper panel). This Western blot analysis was repeated three times using samples from three different pairs of wildtype and Atg7f/fLck-Cre mice. The normalized intensities of three independent experiments are showed in the lower panel figure (mean±SD, *p=0.04). (C). Expression of ER stress markers in autophagy-deficient T cells. Cell lysates of purified total T cell from Atg7f/f or Atg7f/fLck-Cre mice splenocytes were prepared. The expression levels of PDI, Grp78, and Grp94 were analyzed by Western blot. Numbers represent the ratios of the intensity of target molecule band to the intensity of actin band. This Western blot was repeated twice using three pair of wildtype and Atg7f/fLck-Cre mice.
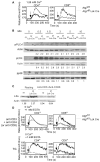
FIGURE 3. Impaired calcium flux in Atg7-deficient T cells
(A). Calcium influx in autophagy-deficient T cells upon TCR engagement. Lymph node cells from Atg7f/f or Atg7f/fLck-Cre mice were loaded with Indo-1 and then stained with7-AAD, anti-CD44-FITC and either anti-CD4-PE or anti-CD8-PE antibodies. Cells were resuspended in HBSS buffer containing 1.26 mM CaCl2. The Indo-1 loaded cells were stimulated with biotin-anti-CD3 (5 μg/ml) and biotin-anti-CD4 (1 μg/ml) antibodies for analysis of CD4+ T cells (or biotin-anti-CD8 antibody for CD8+ T cells) for 1 min. After establishing a base line, the cells were crosslinked with 25 μg/ml streptavidin and the stimulation was indicated by the arrow in the figure (same in other calcium flux figures). Intracellular Ca2+ kinetics were expressed as the ratio of emission at 405 nm to that at 510 nm. Graphs represent calcium influx in live naïve 7-AAD-CD44low CD4+ or 7-AAD- CD44low CD8+ cells. This experiment was repeated three times independently. (B). Phosphorylation of p38, ERK, and PLCγ1 in autophagy-deficient T cells upon TCR stimulation. Purified naïve CD44low T lymphocytes were stimulated with biotin-labeled anti-CD3 (5 μg/ml), biotin-labeled anti-CD4 (1 μg/ml) and biotin-labeled anti-CD8 (1 μg/ml) for 1 min and crosslinked with streptavidin (25 μg/ml) for 1, 1.5, 3, 5, or 10 min. Phosphorylated proteins were detected with anti-phosphorylated p38, ERK, or PLCγ1 and visualized using Alexa Fluor 680- or IRDye 800-conjugated anti-species antibodies. Numbers represent the ratios of intensity of the target molecule bands to intensity of actin bands. These Western blots analysis were repeated five times using purified T cells from different pairs of wildtype and Atg7f/fLck-Cre mice. (C). IkBα degradation in autophagy-deficient T cells after CD3/CD28 stimulation. T cells were stimulated with anti-CD3 (5μg/ml) and anti-CD28 (2μg/ml) antibodies overnight and whole cell lysates were subjected to Western blot analysis. Numbers represent the ratios of intensity of the IkBα bands to intensity of actin bands. (D). Increased calcium store in Atg7-deficient T cells. Lymph node cells from Atg7f/f or Atg7f/fLck-Cre mice were loaded with Indo-1 in Ca2+-free HBSS buffer. Cells were stained with anti-CD44-FITC and either anti-CD4-PE or anti-CD8-PE, and resuspended in calcium-free HBSS containing 1 mM EGTA. A total of 1×10⁶ cells were incubated in calcium-free conditions with biotin-anti-CD3 and either biotin-anti-CD4 or biotin-anti-CD8 antibodies for 1 min. After establishing a base line using flow cytometry, Ca2+-free streptavidin was added to crosslink anti-CD3 and anti-CD4 (or anti-CD8) antibodies (upper two panels). Above Indo-1 loaded cells were also stimulated with 1μM thapsigargin (TG) in calcium-free HBSS containing 1 mM EGTA to measure the calcium store in ER (lower two panels). The kinetic changes in [Ca2+]i were visualized as the ratio of emission at 405 nm to that at 510 nm over a period of 7 min. All cells were gated on CD44low and 7-AAD negative cells. Above experiments were repeated three times independently.
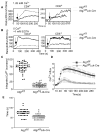
FIGURE 4. Impaired calcium flux in Atg7-deficient T cells stimulated with ionomycin
(A). Calcium influx in autophagy-deficient T cells upon ionomycin stimulation. Lymph node cells from Atg7f/f or Atg7f/fLck-Cre mice were loaded with Indo-1 and stimulated with 13 nM ionomycin. Samples were gated on naïve CD44low CD4+7-AAD- or CD44low CD8+7-AAD- cells. Dashed lines represent Atg7f/f T cells and solid lines represent Atg7f/fLck-Cre T cells. This experiment was repeated four times. (B). Indo-1-loaded cells were stimulated with 60 nM ionomycin in calcium-free HBSS containing 1 mM EGTA, and [Ca2+]i were analyzed over a period of 5 min. Dashed lines represent Atg7f/f cells and solid lines represent Atg7f/fLck-Cre cells. This experiment was repeated three times. (C). The integrated increase in Ca2+ in Atg7f/f or Atg7f/fLck-Cre CD4+ T cells over a period of 5 min. Cells were loaded with Fura-2 and stimulated with 13 nM ionomycin. The integrated Ca2+ increase was calculated as described in Materials and Methods for sixty individual cells. The beginning of calcium influx was defined as the timepoint at which the first 5% increase in fluorescence intensity occurred. Thirty frames were collected over a period of 5 min after the beginning of calcium influx for calculation of the absolute integrated Ca2+ increase for each individual cell (p=6.19×10-46). (D). Kinetics of Ca2+ influx in Atg7-deficient and wildtype T cells. Sixty cells were synchronized by defining the beginning of calcium flux as the timepoint at which the first 5% of cells displayed an increased fluorescence intensity ratio. Images obtained during the 5 min period after initiation of calcium influx were used to analyze kinetic changes in calcium. (E). Length of time to reach the peak level of Ca2+ influx in each individual cell. Calcium influx was calculated in 60 cells for each group (p=6.13×10⁻⁹).
FIGURE 5. The SERCA pump inhibitor thapsigargin rescues the calcium influx defect in Atg7-deficient T cells
(A). The expression of SERCA2 was analyzed by Western blot (left panel). Numbers represent ratios of the intensity of SERCA2 bands to intensity of actin bands. This Western blot analysis was repeated six times using purified T cells from different pairs of wildtype and Atg7-deficient mice splenocytes. Normalized Western blot intensities were quantified and showed in the right panel figure (mean ± SD, *p=0.006). (B). Thapsigargin-induced calcium influx in Atg7-deficient T cells. Lymph node cells from Atg7f/f and Atg7f/fLck-Cre mice were loaded with Indo-1, suspended in HBSS containing 1.26 mM CaCl2 and stimulated with different concentrations of thapsigargin. Samples were gated on naïve CD44low CD4+ 7-AAD- or CD44low CD8+ 7-AAD- cells. Dashed lines represent Atg7f/f cells and solid lines represent Atg7f/fLck-Cre cells. This experiment was repeated three times. (C). Analyzing the calcium influx through CRAC channel in autophagy-deficient T cells by flow cytometry. Lymph node cells from Atg7f/fLck-Cre and Atg7f/f mice were loaded with Indo-1 and cell surfaces were stained with anti-CD4-PE, anti-CD44-FITC and 7-AAD. The Indo-1 loaded cells were resuspended in HBSS containing 1 mM EGTA and 1 mM EDTA but without Ca2+ and Mg2+. After establishing a base level of fluorescence intensity ratio of 405 nm to 510 nm on flow cytometry for 1 min, the Indo-1 loaded cells were stimulated with 1 μM thapsigargin (TG) and the events were collected over a period of 7 min. Then the flow cytometry was paused and TG stimulated cells were spun down. The Ca2+-free buffer was removed and replaced with HBSS containing 1.26 mM Ca2+. The TG stimulated cells were washed once and then resuspended in HBSS with 1.26 mM Ca2+. The flow cytometry was resumed and more events were recorded for another 7 min period. The profiles were gated on CD4+CD44LOW7-AAD- cell population. This experiment was repeated three times independently.
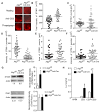
FIGURE 6. Impaired redistribution of STIM-1 in Atg7-deficient T cells
Purified T cells were added to glass coverslips coated with anti-CD3 antibody or anti-H-2Kb antibody, incubated for 20 min, and fixed with 2% paraformaldehyde. Cells were surface stained with anti-CD4 and intracellularly stained with anti-STIM-1 antibody. Z-stack images were captured at 1 μm intervals using 100x oil objective. The best focused layers were used to quantitate the fluorescence intensity of STIM-1 in resting wildtype and Atg7f/fLck-Cre CD4+ cells. More than 30 individual cells were analysed. For the analysis of STIM-1 punctae, one layer was selected from 3D deconvolution images, and the layers on either side of the selected layer were subtracted. The size and intensity of STIM-1 punctae were measured using MetaMorph 7.6 software. Fifty wildtype or Atg7f/fLck-Cre CD4+ cells were randomly selected for analysis. (A). Representative images of endogenous of STIM-1 and STIM-1 punctae in wildtype and Atg7f/fLck-Cre CD4+ cells stimulated by anti-CD3 mAb or thapsigargin. Images were obtained with Zeiss ApoTome system using AxioVision software with a 63x oil objective. (B). Fluorescence intensity of STIM-1 in resting wildtype and Atg7f/fLck-Cre CD4+ cells. (C). Area of STIM-1 punctae in anti-CD3 antibody activated wildtype and Atg7f/fLck-Cre CD4+ cells (p=0.6). (D). Fluorescence intensity of STIM-1 punctae in anti-CD3 antibody activated CD4 cells (p=3.5×10⁻¹⁵). (E). Area of STIM-1 punctae in wildtype and Atg7f/fLck-Cre CD4+ cells stimulated with thapsigargin (p=0.03). The LN cells from wildtype or Atg7f/fLck-Cre mice were stimulated with 100nM thapsigargin for 20min. The cells were fixed and stained intracellularly with STIM-1 antibody. The images of STIM-1 punctae were captured and quantitated using the same method as described above. (F). Fluorescence intensity of STIM-1 punctae in wildtype and Atg7f/fLck-Cre CD4+ cells stimulated with thapsigargin (p=0.16). (G). Protein expressions of STIM-1 and Orai1 in Atg7-deficient T cells. The Western blot was repeated three times using purified T cells from three different pairs of wildtype and Atg7f/fLck-Cre mice. The numbers represents the ratios of intensity of STIM-1 or Orai1 bands to the intensity of actin bands. Normalized Western blot intensities were quantified and shown in the right panel. STIM-1 (mean±SD, *p=0.0069). Orai1 (mean±SD, p=0.47). (H). IL-2 production by autophagy-deficient T cells. Purified naïve CD4+ T cells were stimulated with plate-bound anti-CD3 (5μg/ml) or anti-CD3 plus anti-CD28 (2μg/ml) over night. IL-2 in the cell culture supernatants was measured by ELISA. (*p=0.0057, **p=0.00049).
Similar articles
- Autophagy, a novel pathway to regulate calcium mobilization in T lymphocytes.
Jia W, He MX, McLeod IX, He YW. Jia W, et al. Front Immunol. 2013 Jul 4;4:179. doi: 10.3389/fimmu.2013.00179. eCollection 2013. Front Immunol. 2013. PMID: 23847620 Free PMC article. - Temporal regulation of intracellular organelle homeostasis in T lymphocytes by autophagy.
Jia W, He YW. Jia W, et al. J Immunol. 2011 May 1;186(9):5313-22. doi: 10.4049/jimmunol.1002404. Epub 2011 Mar 18. J Immunol. 2011. PMID: 21421856 - Defective autophagy in vascular smooth muscle cells alters contractility and Ca²⁺ homeostasis in mice.
Michiels CF, Fransen P, De Munck DG, De Meyer GR, Martinet W. Michiels CF, et al. Am J Physiol Heart Circ Physiol. 2015 Mar 15;308(6):H557-67. doi: 10.1152/ajpheart.00659.2014. Epub 2015 Jan 9. Am J Physiol Heart Circ Physiol. 2015. PMID: 25576626 - Molecular physiology and pathophysiology of stromal interaction molecules.
Nelson HA, Roe MW. Nelson HA, et al. Exp Biol Med (Maywood). 2018 Mar;243(5):451-472. doi: 10.1177/1535370218754524. Epub 2018 Jan 24. Exp Biol Med (Maywood). 2018. PMID: 29363328 Free PMC article. Review. - The Role of Mitochondria in the Activation/Maintenance of SOCE: Membrane Contact Sites as Signaling Hubs Sustaining Store-Operated Ca2+ Entry.
Demaurex N, Guido D. Demaurex N, et al. Adv Exp Med Biol. 2017;993:277-296. doi: 10.1007/978-3-319-57732-6_15. Adv Exp Med Biol. 2017. PMID: 28900920 Review.
Cited by
- Calcium homeostasis and ER stress in control of autophagy in cancer cells.
Kania E, Pająk B, Orzechowski A. Kania E, et al. Biomed Res Int. 2015;2015:352794. doi: 10.1155/2015/352794. Epub 2015 Mar 3. Biomed Res Int. 2015. PMID: 25821797 Free PMC article. Review. - Autophagy protects against active tuberculosis by suppressing bacterial burden and inflammation.
Castillo EF, Dekonenko A, Arko-Mensah J, Mandell MA, Dupont N, Jiang S, Delgado-Vargas M, Timmins GS, Bhattacharya D, Yang H, Hutt J, Lyons CR, Dobos KM, Deretic V. Castillo EF, et al. Proc Natl Acad Sci U S A. 2012 Nov 13;109(46):E3168-76. doi: 10.1073/pnas.1210500109. Epub 2012 Oct 23. Proc Natl Acad Sci U S A. 2012. PMID: 23093667 Free PMC article. - Key roles of autophagy in regulating T-cell function.
Botbol Y, Guerrero-Ros I, Macian F. Botbol Y, et al. Eur J Immunol. 2016 Jun;46(6):1326-34. doi: 10.1002/eji.201545955. Eur J Immunol. 2016. PMID: 27151577 Free PMC article. Review. - mTOR, metabolism, and the regulation of T-cell differentiation and function.
Waickman AT, Powell JD. Waickman AT, et al. Immunol Rev. 2012 Sep;249(1):43-58. doi: 10.1111/j.1600-065X.2012.01152.x. Immunol Rev. 2012. PMID: 22889214 Free PMC article. Review. - A new look at T cell receptor signaling to nuclear factor-κB.
Paul S, Schaefer BC. Paul S, et al. Trends Immunol. 2013 Jun;34(6):269-81. doi: 10.1016/j.it.2013.02.002. Epub 2013 Mar 7. Trends Immunol. 2013. PMID: 23474202 Free PMC article. Review.
References
- Mizushima N, Ohsumi Y, Yoshimori T. Autophagosome formation in mammalian cells. Cell Structure & Function. 2002;27:421–429. - PubMed
- Klionsky DJ. Autophagy: from phenomenology to molecular understanding in less than a decade. Nat Rev Mol Cell Biol. 2007;8:931–937. - PubMed
- Münz C. Enhancing Immunity Through Autophagy. Annu Rev Immunol. 2009;27:423–449. - PubMed
- Ohsumi Y. Molecular dissection of autophagy: two ubiquitin-like systems. Nat Rev Mol Cell Biol. 2001;2:211–216. - PubMed
Publication types
MeSH terms
Substances
LinkOut - more resources
Full Text Sources
Other Literature Sources
Molecular Biology Databases
Miscellaneous


