Basolateral sorting signals regulating tissue-specific polarity of heteromeric monocarboxylate transporters in epithelia - PubMed (original) (raw)
Basolateral sorting signals regulating tissue-specific polarity of heteromeric monocarboxylate transporters in epithelia
John J Castorino et al. Traffic. 2011 Apr.
Abstract
Many solute transporters are heterodimers composed of non-glycosylated catalytic and glycosylated accessory subunits. These transporters are specifically polarized to the apical or basolateral membranes of epithelia, but this polarity may vary to fulfill tissue-specific functions. To date, the mechanisms regulating the tissue-specific polarity of heteromeric transporters remain largely unknown. Here, we investigated the sorting signals that determine the polarity of three members of the proton-coupled monocarboxylate transporter (MCT) family, MCT1, MCT3 and MCT4, and their accessory subunit CD147. We show that MCT3 and MCT4 harbor strong redundant basolateral sorting signals (BLSS) in their C-terminal cytoplasmic tails that can direct fusion proteins with the apical marker p75 to the basolateral membrane. In contrast, MCT1 lacks a BLSS and its polarity is dictated by CD147, which contains a weak BLSS that can direct Tac, but not p75 to the basolateral membrane. Knockdown experiments in MDCK cells indicated that basolateral sorting of MCTs was clathrin-dependent but clathrin adaptor AP1B-independent. Our results explain the consistently basolateral localization of MCT3 and MCT4 and the variable localization of MCT1 in different epithelia. They introduce a new paradigm for the sorting of heterodimeric transporters in which a hierarchy of apical and BLSS in the catalytic and/or accessory subunits regulates their tissue-specific polarity.
© 2011 John Wiley & Sons A/S.
Figures
Figure 1. Models of MCT sorting in different epithelia
In RPE cells, MCT1/CD147 is polarized to the apical and MCT3/CD147 to the basolateral membrane. In wild-type MDCK cells, all MCT/CD147 complexes are sorted basolaterally. When rCD147-L252A is expressed in MDCK cells, MCT1/ rCD147-L252A complexes are localized to the apical membrane while MCT1/CD147 complexes are basolateral. In contrast, endogenously expressed MCT4 or exogenously expressed MCT3 remain basolateral whether they are complexed with endogenous CD147 or with exogenously expressed rCD147-L252A, indicating that MCT3 and MCT4 both harbor BLSS.
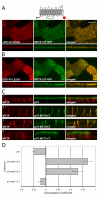
Figure 2. The MCT3 and MCT4 C-terminal cytoplasmic tails dictate polarity
Vectors expressing C-terminally truncated (A) MCT4-GFP and (B) MCT3-GFP fusions were stably expressed MDCK-rCD147-L252A cells. Cells were cultured on Transwell inserts and four days after they reached confluency, were fixed and immunolabeled with anti-rat CD147 antibody (red). Images of the MDCK cells were acquired using LSCM. Upper panels of each row are X-Y images of projections of the entire Z-stack. Bottom panels of each row are X-Z sections from the Z-stack. (C) MDCK cells were transfected with vectors expressing p75 with no cytoplasmic tail or with the appended MCT4, MCT3 or MCT1 C-terminal tails. Polarized MDCK cells stably expressing the fusion proteins were fixed and immunolabeled with p75 antibody (green) to detect the p75-MCT chimeras and MCT4 antibody (red) to detect endogenous MCT4 as basolateral marker. Images are shown as X-Y images of projections of the entire Z-stack (upper panels in each row) and X-Z sections of the Z-stack (bottom panels in each row). Bar=10μm, all images are same scale. (D) Colocalization analysis was performed on the red versus green channels of confocal Z-stacks as described in Methods and Pearson’s correlation coefficients were plotted. Error bars are standard deviations of the colocalization coefficients from at least four regions of interest.
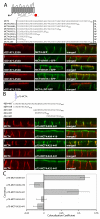
Figure 3. Identification of the MCT4 BLSS
(A) In order to identify the general location of the BLSS, additional constructs with progressive C-terminal truncations of MCT4 were generated as GFP fusions and stably expressed in MDCK-rCD147-L252A cells. The C-terminal tail sequences and resulting polarity for each construct are shown in the table above the figure (NP=nonpolar, BL=basolateral). Polarized cells cultured on Transwell inserts were fixed and immunolabeled with anti-rat CD147 antibody (red). Images of the MDCK cells were acquired using LSCM. (B) An array of p75 fusion constructs was generated to identify the BLSS activity within MCT4 amino acids 409-441. Polarized MDCK cells stably expressing the p75 fusion constructs were fixed and immunolabeled with an anti-p75 antibody (green) to detect the transgenes and anti-MCT4 antibody (red) as an endogenous basolateral marker. Confocal images are shown as X-Z images of representative sections of the Z-stack. Bar=10μm, all images are same scale. (C) Colocalization analysis was performed on the red versus green channels of confocal Z-stacks as described in Methods and Pearson’s colocalization coefficients were plotted. Error bars are standard deviations of the colocalization coefficients from at least four regions of interest.
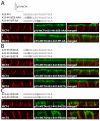
Figure 4. Critical roles of EEE and PP within the MCT4:423-441 BLSS
(A) Polarized MDCK cells stably expressing p75-MCT4:423-441 with either all E425, E426, E427 or both P432 and P433 residues mutated to alanine were fixed and immunolabeled with anti-p75 antibody (green) to detect the transgenes and anti-MCT4 antibody (red) as an endogenous basolateral marker. The C-terminal tail sequences for each construct are shown above the figure. Further mutations were made to the individual (B) glutamate and (C) proline residues. Confocal images are shown as X-Z images of representative sections of the Z-stack. Bar=10μm, all images are same scale.
Figure 5. Identification of an additional BLSS within MCT4
(A) To confirm the BLSS activity of the glutamate and proline residues they were mutated in MCT4-GFP and MCT4:R441Δ-GFP and constructs were stably expressed in MDCK-rCD147-L252A cells. Polarized cells were fixed and immunolabeled with anti-rat CD147 antibody (red). (B) Polarized MDCK cells stably expressing p75-MCT4:441-465 and mutated and truncated p75-MCT4:441-465 constructs were fixed and immunolabeled with anti-p75 antibody (green) to detect the transgenes and anti-MCT4 antibody (red) to detect endogenous MCT4 (red). Confocal images are shown as X-Z images of representative sections of from the Z-stack. Bar=10μm, all images are same scale.
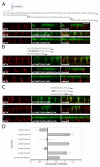
Figure 6. Identifying the BLSS of MCT3
p75-MCT3 tail constructs comprised of adjacent regions of the MCT3 C-terminal cytoplasmic tail were generated and stably expressed in MDCK cells. The C-terminal tail sequences for each construct are shown above the figure. (A) p75-MCT3 fusions of the C-terminal cytoplasmic tail divided into three sections. MCT3:451-484 was divided into two smaller fragments 451-469 (B) and 470-484 (C) and additional mutation analysis was performed on each of these regions. Polarized cells expressing the p75-MCT3 fusion constructs were fixed and immunolabeled with anti-p75 antibody (green) to detect the transgenes and anti-MCT4 antibody (red) to detect endogenous MCT4. Confocal images are shown as X-Z sections from the Z-stack. Bar=10μm, all images are same scale. (D) Colocalization analysis was performed on the red versus green channels of confocal Z-stacks as described in Methods and Pearson’s colocalization coefficients were plotted. Error bars are standard deviations of the colocalization coefficients from at least four regions of interest.
Figure 7. The BLSS of MCT3 and MCT4 are transferable to MCT1
MDCK cells stably expressing rCD147-L252A were transfected with MCT1-GFP, MCT1ΔCT-MCT3:432-504-GFP, or MCT1-MCT4:423-441-GFP constructs. Non-clonal stable cell lines were selected and cultured on Transwell inserts. Polarized cells were fixed and immunostained with anti-rCD147 antibody (red). Confocal images are shown as X-Z sections from the Z-stack. Bar=10μM, all images are same scale.
Figure 8. The steady state basolateral localization of MCTs is clathrin-dependent, but μ1B-independent
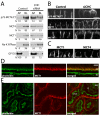
MDCK cells stably expressing p75-MCT4:CT were transfected with siRNA against CHC or luciferase (Control) and the steady-state distribution of p75-MCT4:CT and endogenously expressed proteins was determined by domain-selective cell-surface biotinylation of polarized MDCK cells cultured on Transwell inserts and western blot (A) and LSCM (B). (C) Additionally, the polarity of endogenous MCT1 and MCT4 were determined by LSCM in cells where AP1B complex component μ1B was stably knocked down (20). Confocal images are shown as X-Z sections from the Z-stack. Mouse tissues sections were stained for MCT1 (red) and phalloidin (green) to show that even though neither the RPE (D) nor proximal convoluted tubule (E) express AP1B, the polarity of MCT1 is different between these tissues. AP=apical, BL=basolateral, PCT=proximal convoluted tubule; bar=10μm.
Figure 9. p75-rCD147:CT is polarized to the apical membrane in MDCK cells
(A) As previously shown, a GFP fusion protein consisting of the extracellular and transmembrane domains of Tac with the cytoplasmic domain of rCD147 was sorted basolaterally. (B) A p75-rCD147 fusion protein comprised of the extracellular and transmembrane domain of p75 and the cytoplasmic tail of CD147 and stably expressed in MDCK cells. Polarized MDCK-p75-rCD147 cells cultured on transwell inserts were fixed and immunolabeled with anti-p75 antibody (green) to detect the p75-CD147 fusion protein and anti-MCT4 antibody (red) as a basolateral marker. Confocal images are shown as projections of the entire Z-stack (upper panels) and X-Z images (lower panels) of representative sections of the Z-stack. Bar=10μm, all images are same scale.
Similar articles
- Mechanisms regulating tissue-specific polarity of monocarboxylate transporters and their chaperone CD147 in kidney and retinal epithelia.
Deora AA, Philp N, Hu J, Bok D, Rodriguez-Boulan E. Deora AA, et al. Proc Natl Acad Sci U S A. 2005 Nov 8;102(45):16245-50. doi: 10.1073/pnas.0504419102. Epub 2005 Oct 31. Proc Natl Acad Sci U S A. 2005. PMID: 16260747 Free PMC article. - Polarized expression of monocarboxylate transporters in human retinal pigment epithelium and ARPE-19 cells.
Philp NJ, Wang D, Yoon H, Hjelmeland LM. Philp NJ, et al. Invest Ophthalmol Vis Sci. 2003 Apr;44(4):1716-21. doi: 10.1167/iovs.02-0287. Invest Ophthalmol Vis Sci. 2003. PMID: 12657613 - Loss of MCT1, MCT3, and MCT4 expression in the retinal pigment epithelium and neural retina of the 5A11/basigin-null mouse.
Philp NJ, Ochrietor JD, Rudoy C, Muramatsu T, Linser PJ. Philp NJ, et al. Invest Ophthalmol Vis Sci. 2003 Mar;44(3):1305-11. doi: 10.1167/iovs.02-0552. Invest Ophthalmol Vis Sci. 2003. PMID: 12601063 - Monocarboxylic acid transport.
Halestrap AP. Halestrap AP. Compr Physiol. 2013 Oct;3(4):1611-43. doi: 10.1002/cphy.c130008. Compr Physiol. 2013. PMID: 24265240 Review. - Molecular sorting in polarized and non-polarized cells: common problems, common solutions.
Mellman I, Yamamoto E, Whitney JA, Kim M, Hunziker W, Matter K. Mellman I, et al. J Cell Sci Suppl. 1993;17:1-7. doi: 10.1242/jcs.1993.supplement_17.1. J Cell Sci Suppl. 1993. PMID: 8144683 Review.
Cited by
- Regulation of monocarboxylic acid transporter-1 by cAMP dependent vesicular trafficking in brain microvascular endothelial cells.
Uhernik AL, Li L, LaVoy N, Velasquez MJ, Smith JP. Uhernik AL, et al. PLoS One. 2014 Jan 16;9(1):e85957. doi: 10.1371/journal.pone.0085957. eCollection 2014. PLoS One. 2014. PMID: 24454947 Free PMC article. - Monocarboxylate Transporters (SLC16): Function, Regulation, and Role in Health and Disease.
Felmlee MA, Jones RS, Rodriguez-Cruz V, Follman KE, Morris ME. Felmlee MA, et al. Pharmacol Rev. 2020 Apr;72(2):466-485. doi: 10.1124/pr.119.018762. Pharmacol Rev. 2020. PMID: 32144120 Free PMC article. Review. - MCT4 Promotes Hepatocellular Carcinoma Progression by Upregulating TRAPPC5 Gene.
Niu Z, Yang F, Li H, Wang J, Ni Q, Ma C, Zhu H, Chang H, Zhou X, Lu J, Gao H. Niu Z, et al. J Hepatocell Carcinoma. 2022 Apr 8;9:289-300. doi: 10.2147/JHC.S352948. eCollection 2022. J Hepatocell Carcinoma. 2022. PMID: 35425722 Free PMC article. - Regulation of Mct1 by cAMP-dependent internalization in rat brain endothelial cells.
Smith JP, Uhernik AL, Li L, Liu Z, Drewes LR. Smith JP, et al. Brain Res. 2012 Oct 22;1480:1-11. doi: 10.1016/j.brainres.2012.08.026. Epub 2012 Aug 20. Brain Res. 2012. PMID: 22925948 Free PMC article. - Directional Fluid Transport across Organ-Blood Barriers: Physiology and Cell Biology.
Caceres PS, Benedicto I, Lehmann GL, Rodriguez-Boulan EJ. Caceres PS, et al. Cold Spring Harb Perspect Biol. 2017 Mar 1;9(3):a027847. doi: 10.1101/cshperspect.a027847. Cold Spring Harb Perspect Biol. 2017. PMID: 28003183 Free PMC article. Review.
References
- Brown D, Stow JL. Protein trafficking and polarity in kidney epithelium: from cell biology to physiology. Physiol Rev. 1996;76(1):245–297. - PubMed
- Philp NJ, Shoshani L, Cereijido M, Rodriguez-Boulan E. Epithelial Domains. In: Nabi IR, editor. Cellular Domains. Wiley Press; 2010.
Publication types
MeSH terms
Substances
Grants and funding
- R56 EY012042/EY/NEI NIH HHS/United States
- R01 GM034107/GM/NIGMS NIH HHS/United States
- EY08538/EY/NEI NIH HHS/United States
- R01 EY008538/EY/NEI NIH HHS/United States
- EY-012042/EY/NEI NIH HHS/United States
- GM34107/GM/NIGMS NIH HHS/United States
- R01 EY012042/EY/NEI NIH HHS/United States
- P32-ES-07282/ES/NIEHS NIH HHS/United States
- T32 ES007282/ES/NIEHS NIH HHS/United States
LinkOut - more resources
Full Text Sources
Other Literature Sources
Molecular Biology Databases
Research Materials

