Sirtuin-1 targeting promotes Foxp3+ T-regulatory cell function and prolongs allograft survival - PubMed (original) (raw)
Sirtuin-1 targeting promotes Foxp3+ T-regulatory cell function and prolongs allograft survival
Ulf H Beier et al. Mol Cell Biol. 2011 Mar.
Abstract
Sirtuin 1 (Sirt1), a class III histone/protein deacetylase, is central to cellular metabolism, stress responses, and aging, but its contributions to various host immune functions have been little investigated. To study the role of Sirt1 in T cell functions, we undertook targeted deletions by mating mice with a floxed Sirt1 gene to mice expressing CD4-cre or Foxp3-cre recombinase, respectively. We found that Sirt1 deletion left conventional T-effector cell activation, proliferation, and cytokine production largely unaltered. However, Sirt1 targeting promoted the expression of Foxp3, a key transcription factor in T-regulatory (Treg) cells, and increased Treg suppressive functions in vitro and in vivo. Consistent with these data, mice with targeted deletions of Sirt1 in either CD4(+) T cells or Foxp3(+) Treg cells exhibited prolonged survival of major histocompatibility complex (MHC)-mismatched cardiac allografts. Allografts in Sirt1-targeted recipients showed long-term preservation of myocardial histology and infiltration by Foxp3(+) Treg cells. Comparable results were seen in wild-type allograft recipients treated with Sirt1 inhibitors, such as EX-527 and splitomicin. Hence, Sirt1 may inhibit Treg functions, and its targeting may have therapeutic value in autoimmunity and transplantation.
Figures
FIG. 1.
Differential effects of cell activation on sirtuin gene expression by conventional T cells versus Tregs. Expression of sirtuin genes 1 to 7 (qPCR, mean ± SD, 3/group) by resting and activated T-effector cells and Tregs is shown. Activation was induced for 24 h using CD3ɛ MAb (1 μg/ml) and irradiated APC, and data from stimulated versus unstimulated cells (n = 3/group) were assessed (*, P < 0.05; **, P < 0.01; ***, P < 0.001 [versus results for unstimulated cells]).
FIG. 2.
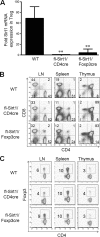
Targeted deletion of Sirt1 in T cells and Tregs. (A) Expression of Sirt1 by WT Tregs (CD4+ CD25+, isolated by magnetic beads, 85% Foxp3+ Treg purity) versus corresponding cells from fl-Sirt1/CD4cre or fl-Sirt1/Foxp3cre mice (qPCR, mean ± SD, 3/group; **, P < 0.01 versus results for WT). (B and C) Flow cytometric analysis of T cell populations in thymi, peripheral lymph nodes (LN), and spleens of WT mice or mice with deletion of Sirt1 using CD4cre (B) or Foxp3cre (C); the percentage of each population is indicated, and data are representative of 3 mice/group.
FIG. 3.
Sirt1 deletion does not alter T-effector cell activation. (A) In vitro stimulation of CFSE-labeled CD4+ CD25− T-effector cells showed no difference in proliferation between fl-Sirt1/CD4cre and WT cells upon activation by CD3ɛ ± CD28 MAb and APC (1 × 10⁶/ml). (B) Parent-to-F1 assay: CFSE-labeled T-effector cells from WT or fl-Sirt1/CD4cre mice (both H-2b) were injected into H-2b/d mice. After 3 days, injected cells (H-2d negative) were analyzed for proliferation, cellular activation, and cytokine production. For all parameters shown, data from fl-Sirt1/CD4cre and WT T-effector cells were comparable; error bars represent results of 3 independent assays (P > 0.05 in all cases).
FIG. 4.
Sirt1 and Treg function. (A) Comparison of the ability of Sirt1−/− versus WT Tregs to suppress proliferation of CFSE-labeled WT effector T cells in vitro, showing the enhanced suppressive function of Sirt1−/− Tregs (*, P < 0.05; **, P < 0.01 [versus results for WT Tregs]). (B) In vitro suppression assay showing effect of the sirtuin inhibitor splitomicin on WT Treg function; residual proliferation of CFSE-labeled T cells is shown in each panel. (C) In vitro suppression assay showing effect of the Sirt1-specific inhibitor EX-527 on Treg function; residual proliferation of CFSE-labeled T cells is shown in each panel. (D) Homeostatic proliferation showed enhanced suppressive function of Sirt1 deletion Tregs in vivo (**, P < 0.01; ***, P < 0.005). Abbreviations: SC, fl-Sirt1/CD4cre; SF, fl-Sirt1/Foxp3cre.
FIG. 5.
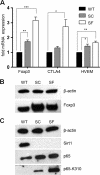
Sirt1 and Foxp3 expression. (A) qPCR showing upregulation of Foxp3, CTLA-4, and herpesvirus entry mediator (HVEM) mRNA in Sirt1−/− versus WT Tregs (n = 4/group; *, P < 0.05; **, P < 0.01; ***, P < 0.005). (B) Western blotting showing increased Foxp3 protein in Sirt1−/− versus WT Tregs (actin loading control). (C) Immunoprecipitation of Foxp3,= followed by Western blotting for acetylated lysine showed increased Foxp3 acetylation in Sirt1−/− versus WT Tregs. (C) Western blot comparing Sirt1 and p65, both total and acetylated at lysine 310, showing that Sirt1−/− Tregs exhibit more acetylated p65 and total p65. Abbreviations: SC, fl-Sirt1/CD4cre; SF, fl-Sirt1/Foxp3cre.
FIG. 6.
Microarray analysis of expression of genes relevant to Treg function. Data displayed are ≥2× differentially expressed Sirt1−/− Tregs compared to WT Tregs (P < 0.05). Data are displayed after z-score transformation; see the text for details. Abbreviations: SC, fl-Sirt1/CD4cre; SF, fl-Sirt1/Foxp3cre; Ifng, IFN-γ; Ccr/ccl, chemokine (C-C motif) receptor/ligand; Xcl, chemokine (C motif) ligand; Icam, intercellular adhesion molecule; Il6ST, IL-6 signal transducer; Fasl, Fas ligand; Hsp, heat shock protein; Tnfrsf, tumor necrosis factor receptor superfamily; Ikbkb, inhibitor of κB kinase beta; Prf, perforin; Traf, TNFR-associated factor; Itga4, integrin alpha 4; Dnmt, DNA methyltransferase; Tgfbr, transforming growth factor β receptor; Pdk, pyruvate dehydrogenase kinase; Sdh, succinate dehydrogenase; Vps33b, vacuolar protein sorting 33B; Idh, isocitrate dehydrogenase; Sucl, succinate-coenzyme A ligase; Cs, citrate synthase; Fh, fumarate hydratase; CyP51, cytochrome P450 family 51; Idi1, isopentenyl-diphosphate delta isomerase; Hmgcs1, 3-hydroxy-3-methylglutaryl-coenzyme A synthase 1; Sqle, squalene epoxidase; Dhcr7, 7-dehydrocholesterol reductase; Lss, lanosterol synthase; Hdac, histone deacetylase.
FIG. 7.
Sirt1 and allograft survival. (A) Kaplan-Meier survival curves showing prolonged survival of MHC-mismatched cardiac allografts following Sirt1 deletion in CD4+ T cells (fl-Sirt1/CD4cre) or Sirt1 inhibition versus WT recipients (4 to 5 grafts/group). (B) Allograft histology at 9 days posttransplant shows a similar degree of lymphocyte infiltration but better myocyte preservation, with intact nuclei and cross striations of fl-Sirt1/CD4cre recipients. For low-power (upper) or high-power (lower) magnifications, scale bar equals 200 μm or 50 μm, respectively. (C) Corresponding immunoperoxidase detection at 9 days posttransplant of CD4+, CD8+, and Foxp3+ T cells in cardiac allografts in WT mice or mice with deletion of Sirt1 using CD4cre; considerably more infiltrating Foxp3+ cells are noted in interstitial areas of fl-Sirt1/CD4cre versus WT recipients; scale bar = 50 μm. (D) qPCR analysis of whole-tissue RNA obtained from allografts and native BALB/c hearts (gray box) as a control, showing increased intragraft Foxp3 and decreased IFN-γ and Sirt1 in Sirt1−/− recipients. (E) Flow cytometric analysis of splenic CD4+ T cells shows decreased activation in Sirt1−/− versus WT allograft recipients. (B to E are representative of 2 independent experiments). (F) B6/RAG1−/− cardiac allograft recipients were adoptively transferred with T-effector cells and WT versus fl-Sirt1/CD4cre Tregs; a significant benefit of Sirt1 deletion in Tregs was shown. (G) Likewise, fl-Sirt1/Foxp3cre recipients exhibited prolonged allograft survival compared to WT controls. Statistical analysis: *, P < 0.05; **, P < 0.01; ***, P < 0.005; Mantel-Cox test versus results for untreated WT (A, F, and G) or Student t test versus results for BALB/c heart control (D).
Similar articles
- Targeting Sirtuin-1 prolongs murine renal allograft survival and function.
Levine MH, Wang Z, Xiao H, Jiao J, Wang L, Bhatti TR, Hancock WW, Beier UH. Levine MH, et al. Kidney Int. 2016 May;89(5):1016-1026. doi: 10.1016/j.kint.2015.12.051. Epub 2016 Mar 16. Kidney Int. 2016. PMID: 27083279 Free PMC article. - Histone/protein deacetylase 11 targeting promotes Foxp3+ Treg function.
Huang J, Wang L, Dahiya S, Beier UH, Han R, Samanta A, Bergman J, Sotomayor EM, Seto E, Kozikowski AP, Hancock WW. Huang J, et al. Sci Rep. 2017 Aug 17;7(1):8626. doi: 10.1038/s41598-017-09211-3. Sci Rep. 2017. PMID: 28819166 Free PMC article. - Abnormal acetylation of FOXP3 regulated by SIRT-1 induces Treg functional deficiency in patients with abdominal aortic aneurysms.
Jiang H, Xin S, Yan Y, Lun Y, Yang X, Zhang J. Jiang H, et al. Atherosclerosis. 2018 Apr;271:182-192. doi: 10.1016/j.atherosclerosis.2018.02.001. Epub 2018 Feb 14. Atherosclerosis. 2018. PMID: 29524861 - Histone/protein deacetylases control Foxp3 expression and the heat shock response of T-regulatory cells.
Beier UH, Akimova T, Liu Y, Wang L, Hancock WW. Beier UH, et al. Curr Opin Immunol. 2011 Oct;23(5):670-8. doi: 10.1016/j.coi.2011.07.002. Epub 2011 Jul 26. Curr Opin Immunol. 2011. PMID: 21798734 Free PMC article. Review. - Histone/protein deacetylase inhibitor therapy for enhancement of Foxp3+ T-regulatory cell function posttransplantation.
Wang L, Beier UH, Akimova T, Dahiya S, Han R, Samanta A, Levine MH, Hancock WW. Wang L, et al. Am J Transplant. 2018 Jul;18(7):1596-1603. doi: 10.1111/ajt.14749. Epub 2018 Apr 21. Am J Transplant. 2018. PMID: 29603600 Free PMC article. Review.
Cited by
- Post-Translational Regulations of Foxp3 in Treg Cells and Their Therapeutic Applications.
Dong Y, Yang C, Pan F. Dong Y, et al. Front Immunol. 2021 Apr 12;12:626172. doi: 10.3389/fimmu.2021.626172. eCollection 2021. Front Immunol. 2021. PMID: 33912156 Free PMC article. Review. - Metabolic signaling in T cells.
Shyer JA, Flavell RA, Bailis W. Shyer JA, et al. Cell Res. 2020 Aug;30(8):649-659. doi: 10.1038/s41422-020-0379-5. Epub 2020 Jul 24. Cell Res. 2020. PMID: 32709897 Free PMC article. Review. - Proximity Ligation Assay to Quantify Foxp3 Acetylation in Regulatory T Cells.
Jiao J, Han R, Hancock WW, Beier UH. Jiao J, et al. Methods Mol Biol. 2017;1510:287-293. doi: 10.1007/978-1-4939-6527-4_21. Methods Mol Biol. 2017. PMID: 27761829 Free PMC article. - Sirtuin-1 in immunotherapy: A Janus-headed target.
Chadha S, Wang L, Hancock WW, Beier UH. Chadha S, et al. J Leukoc Biol. 2019 Aug;106(2):337-343. doi: 10.1002/JLB.2RU1118-422R. Epub 2019 Jan 3. J Leukoc Biol. 2019. PMID: 30605226 Free PMC article. Review. - Nuclear Sirtuins and the Aging of the Immune System.
Gámez-García A, Vazquez BN. Gámez-García A, et al. Genes (Basel). 2021 Nov 23;12(12):1856. doi: 10.3390/genes12121856. Genes (Basel). 2021. PMID: 34946805 Free PMC article. Review.
References
- Bettelli, E., et al. 2006. Reciprocal developmental pathways for the generation of pathogenic effector TH17 and regulatory T cells. Nature 441:235-238. - PubMed
Publication types
MeSH terms
Substances
Grants and funding
- P01 AI073489/AI/NIAID NIH HHS/United States
- T32 DK007006/DK/NIDDK NIH HHS/United States
- R01 AI073489/AI/NIAID NIH HHS/United States
- DK0070063-37/DK/NIDDK NIH HHS/United States
LinkOut - more resources
Full Text Sources
Other Literature Sources
Molecular Biology Databases
Research Materials


