Depot-specific differences and insufficient subcutaneous adipose tissue angiogenesis in human obesity - PubMed (original) (raw)
Comparative Study
. 2011 Jan 18;123(2):186-94.
doi: 10.1161/CIRCULATIONAHA.110.970145. Epub 2011 Jan 3.
Nina Guseva, Celia Hartigan, Sarah Apotheker, Matthew Gorgoglione, Kunal Gurav, Khan-Van Tran, Juerg Straubhaar, Sarah Nicoloro, Michael P Czech, Michael Thompson, Richard A Perugini, Silvia Corvera
Affiliations
- PMID: 21200001
- PMCID: PMC3334340
- DOI: 10.1161/CIRCULATIONAHA.110.970145
Comparative Study
Depot-specific differences and insufficient subcutaneous adipose tissue angiogenesis in human obesity
Olga Gealekman et al. Circulation. 2011.
Erratum in
- Correction to: Depot-Specific Differences and Insufficient Subcutaneous Adipose Tissue Angiogenesis in Human Obesity.
[No authors listed] [No authors listed] Circulation. 2019 Sep 17;140(12):e693. doi: 10.1161/CIR.0000000000000717. Epub 2019 Sep 16. Circulation. 2019. PMID: 31525100 No abstract available.
Abstract
Background: Adipose tissue expands in response to excess caloric intake, but individuals prone to deposit visceral instead of subcutaneous adipose tissue have higher risk of metabolic disease. The role of angiogenesis in the expandability of human adipose tissue depots is unknown. The objective of this study was to measure angiogenesis in visceral and subcutaneous adipose tissue and to establish whether there is a relationship between obesity, metabolic status, and the angiogenic properties of these depots.
Methods and results: Angiogenic capacity was determined by quantifying capillary branch formation from human adipose tissue explants embedded in Matrigel, and capillary density was assessed by immunohistochemistry. Subcutaneous adipose tissue had a greater angiogenic capacity than visceral tissue, even after normalization to its higher initial capillary density. Gene array analyses revealed significant differences in expression of angiogenic genes between depots, including an increased subcutaneous expression of angiopoietin-like protein 4, which is proangiogenic in an adipose tissue context. Subcutaneous capillary density and angiogenic capacity decreased with morbid obesity, and subcutaneous, but not visceral, adipose tissue angiogenic capacity correlated negatively with insulin sensitivity.
Conclusions: These data imply that subcutaneous adipose tissue has a higher capacity to expand its capillary network than visceral tissue, but this capacity decreases with morbid obesity. The decrease correlates with insulin resistance, suggesting that impairment of subcutaneous adipose tissue angiogenesis may contribute to metabolic disease pathogenesis.
Figures
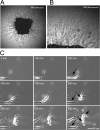
Figure 1. Sprouting of capillary networks from human adipose tissue explants
Adipose tissue explants were embedded in Matrigel and cultured as described in the text. A. Capillary branches emerging from a SQ adipose tissue explant after 14 days in culture. B. Higher magnification of A. C. Time lapse of branch formation at the periphery of the capillary network. Arrows point to three cells that organize over 800 min to form one branch. The growth of the branched network over a 48h period can be seen in Video 1.
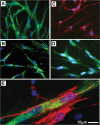
Figure 2. Immuno-phenotype of cells comprising the sprouts formed from human adipose tissue explants
Representative photomicrographs of newly-formed cells stained for endothelial cell markers CD31 (A), CD34 (B), eNOS (C), and vWF (D). E. Cell expressing α-Smooth Muscle Actin (red), presumably a pericyte, attached to vWF positive capillary branch (green).
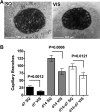
Figure 3. Decreased angiogenic potential in SQ compared to VIS adipose tissue
A. Representative examples of explants from SQ or VIS adipose tissue after 14 days in culture. B. Quantitative analysis of formation of capillary branches from VIS or SQ adipose tissue after 7 and 14 days in culture, and growth rate estimated as the difference between days 14 and 7. Bars indicate the mean and SEM of 26 patients. The p-values were calculated by two-tailed paired Student t-tests between SQ and VIS samples from the same patient.
Figure 4. Decreased capillary density in SQ compared to VIS adipose tissue
A and B. Sections of SQ and VIS adipose tissue stained with antibody to von Willebrand factor (vWF) (A) and CD31 (B) antibody. Arrows point to some of the capillary lumens in each section. C. Normalization of capillary density by adipocyte number. D. Measurement of adipocyte size. E. Representative example of Western blots of SQ and VIS adipose tissue samples from 4 individuals probed with anti-CD31. The bands were scanned, and the integrated density value for each band was calculated using Photoshop CS4 software. Β-actin was used as loading control. F. Normalization of angiogenic capacity by capillary density. For C, D, E, and F bars represent the means and SEM. P-values were calculated by two-tailed paired Wilcoxon matched pair test, n=7.
Figure 5. Gene expression differences between SQ and VIS adipose tissue
A. Heat map of genes displaying 1.5 fold or higher difference in expression between depots, at a p-value less than 0.005. Genes clustered into two groups (C1 and C2), which were analyzed further as described in the text. B. 20 μg of protein from paired samples of SQ and VIS adipose tissue was analyzed by Western blotting with antibodies to angiopoietin-like protein 4 (ANGPTL4) and β-actin. Shown are representative examples of the data obtained at two different exposures (1 min, top and bottom, and 5 min, middle). The integrated density value for each band was calculated using Photoshop CS4 software, and plotted as the ratio of the integrated density values between ANGPTL4 and β-actin. P-value was determined by the 2-tailed Wilcoxon matched pair test, n=8.
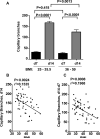
Figure 6. Decreased SQ adipose tissue angiogenic capacity with increase in obesity
A. Comparative analysis of capillary sprout formation in overweight (BMI 25 - 35.5, n=28) and morbidly obese (BMI 36 - 59, n=26) individuals. P-values represent statistical significance calculated by unpaired 2-tailed Student t-tests. B, C. Linear regression analysis between BMI and SQ adipose tissue capillary branch formation at day 14 (B), and between the rate of growth ex-vivo calculated as the difference between day14 and day 7 (C). Data for linear regression was from all subjects available, encompassing a range of BMI between 25 and 59, n=54. P and r2 values for each analysis are shown.
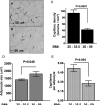
Figure 7. Decrease in SQ adipose tissue capillary density in morbidly obese as compared to overweight individuals
Sections of SQ adipose tissue from individuals with BMI 25 - 35.5 (A), or 36 - 59 (B) stained with anti vWF antibody. Arrows point to examples of capillary lumens. C. Quantification of capillary lumens per field. Bars represent the means and SEM of explants from 10 (BMI 25 – 35.5) or 7 (BMI 36 - 59) individuals per condition. The value for each patient was the average number of lumens per field calculated from 3 independent sections (10 fields per section). D. Measurement of adipocyte size and E. Normalization of capillary density by adipocyte number. The statistical analysis was based on two-tailed unpaired Student t-test.
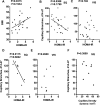
Figure 8. Correlation between insulin sensitivity and capillary branch growth
A, B, and C: Linear regression analysis between HOMA-IR and (A) BMI, (B) SQ ex-vivo angiogenic growth, and (C) VIS ex-vivo angiogenic growth in 26 gastric bypass surgery patients. D, E: Linear regression analysis between HOMA-IR and (D) SQ angiogenic growth and (E) VIS angiogenic growth in a subgroup of the patients (n=8) analyzed in A, B and C. F. Linear regression analysis between capillary density of the originating tissue and angiogenic growth in the same subpopulation. P-values for each analysis are shown. r2 values are shown for those cases in which statistical significance was found. Data for each patient can be found in Supplementary Table 1.
Similar articles
- Fat-Specific Protein 27 Regulation of Vascular Function in Human Obesity.
Karki S, Farb MG, Sharma VM, Jash S, Zizza EJ, Hess DT, Carmine B, Carter CO, Pernar LI, Apovian CM, Puri V, Gokce N. Karki S, et al. J Am Heart Assoc. 2019 Jun 4;8(11):e011431. doi: 10.1161/JAHA.118.011431. Epub 2019 Jun 1. J Am Heart Assoc. 2019. PMID: 31433737 Free PMC article. - WNT5A regulates adipose tissue angiogenesis via antiangiogenic VEGF-A165b in obese humans.
Karki S, Ngo DTM, Farb MG, Park SY, Saggese SM, Hamburg NM, Carmine B, Hess DT, Walsh K, Gokce N. Karki S, et al. Am J Physiol Heart Circ Physiol. 2017 Jul 1;313(1):H200-H206. doi: 10.1152/ajpheart.00776.2016. Epub 2017 Apr 14. Am J Physiol Heart Circ Physiol. 2017. PMID: 28411232 Free PMC article. - Arteriolar function in visceral adipose tissue is impaired in human obesity.
Farb MG, Ganley-Leal L, Mott M, Liang Y, Ercan B, Widlansky ME, Bigornia SJ, Fiscale AJ, Apovian CM, Carmine B, Hess DT, Vita JA, Gokce N. Farb MG, et al. Arterioscler Thromb Vasc Biol. 2012 Feb;32(2):467-73. doi: 10.1161/ATVBAHA.111.235846. Epub 2011 Nov 17. Arterioscler Thromb Vasc Biol. 2012. PMID: 22095978 Free PMC article. - Role of subcutaneous adipose tissue in the pathogenesis of insulin resistance.
Patel P, Abate N. Patel P, et al. J Obes. 2013;2013:489187. doi: 10.1155/2013/489187. Epub 2013 Apr 4. J Obes. 2013. PMID: 23691287 Free PMC article. Review. - Under the Surface of Subcutaneous Adipose Tissue Biology.
Pandžić Jakšić V, Grizelj D. Pandžić Jakšić V, et al. Acta Dermatovenerol Croat. 2016 Dec;24(4):250-260. Acta Dermatovenerol Croat. 2016. PMID: 28128075 Review.
Cited by
- Fish Oil Enriched in EPA, but Not in DHA, Reverses the Metabolic Syndrome and Adipocyte Dysfunction Induced by a High-Fat Diet.
da Cunha de Sá RDC, Simão JJ, Silva VSD, Farias TM, Cruz MM, Antraco VJ, Armelin-Correa L, Alonso-Vale MI. da Cunha de Sá RDC, et al. Nutrients. 2021 Feb 26;13(3):754. doi: 10.3390/nu13030754. Nutrients. 2021. PMID: 33652751 Free PMC article. - Visceral and subcutaneous fat quality and cardiometabolic risk.
Rosenquist KJ, Pedley A, Massaro JM, Therkelsen KE, Murabito JM, Hoffmann U, Fox CS. Rosenquist KJ, et al. JACC Cardiovasc Imaging. 2013 Jul;6(7):762-71. doi: 10.1016/j.jcmg.2012.11.021. Epub 2013 May 8. JACC Cardiovasc Imaging. 2013. PMID: 23664720 Free PMC article. - Role of the 12-lipoxygenase pathway in diabetes pathogenesis and complications.
Dobrian AD, Morris MA, Taylor-Fishwick DA, Holman TR, Imai Y, Mirmira RG, Nadler JL. Dobrian AD, et al. Pharmacol Ther. 2019 Mar;195:100-110. doi: 10.1016/j.pharmthera.2018.10.010. Epub 2018 Oct 19. Pharmacol Ther. 2019. PMID: 30347209 Free PMC article. Review. - Perivascular Adipose Tissue and Coronary Atherosclerosis: from Biology to Imaging Phenotyping.
Lin A, Dey D, Wong DTL, Nerlekar N. Lin A, et al. Curr Atheroscler Rep. 2019 Nov 19;21(12):47. doi: 10.1007/s11883-019-0817-3. Curr Atheroscler Rep. 2019. PMID: 31741080 Free PMC article. Review. - The Regulation of Adipose Tissue Health by Estrogens.
Steiner BM, Berry DC. Steiner BM, et al. Front Endocrinol (Lausanne). 2022 May 26;13:889923. doi: 10.3389/fendo.2022.889923. eCollection 2022. Front Endocrinol (Lausanne). 2022. PMID: 35721736 Free PMC article. Review.
References
- Gesta S, Tseng YH, Kahn CR. Developmental origin of fat: tracking obesity to its source. Cell. 2007;131:242–256. - PubMed
- Bouloumie A, Lolmede K, Sengenes C, Galitzky J, Lafontan M. Angiogenesis in adipose tissue. Ann Endocrinol (Paris) 2002;63:91–95. - PubMed
- Crandall DL, Hausman GJ, Kral JG. A review of the microcirculation of adipose tissue: anatomic, metabolic, and angiogenic perspectives. Microcirculation. 1997;4:211–232. - PubMed
- Nishimura S, Manabe I, Nagasaki M, Hosoya Y, Yamashita H, Fujita H, Ohsugi M, Tobe K, Kadowaki T, Nagai R, Sugiura S. Adipogenesis in obesity requires close interplay between differentiating adipocytes, stromal cells, and blood vessels. Diabetes. 2007;56:1517–1526. - PubMed
Publication types
MeSH terms
Substances
Grants and funding
- R01 DK089101-01A1/DK/NIDDK NIH HHS/United States
- R01 DK089101/DK/NIDDK NIH HHS/United States
- P30 DK032520/DK/NIDDK NIH HHS/United States
- DK080366/DK/NIDDK NIH HHS/United States
- DK32520/DK/NIDDK NIH HHS/United States
- R21 DK080366/DK/NIDDK NIH HHS/United States
- R01 DK089101-02/DK/NIDDK NIH HHS/United States
LinkOut - more resources
Full Text Sources
Other Literature Sources
Medical
