5-HT receptors mediate lineage-dependent effects of serotonin on adult neurogenesis in Procambarus clarkii - PubMed (original) (raw)
5-HT receptors mediate lineage-dependent effects of serotonin on adult neurogenesis in Procambarus clarkii
Yi Zhang et al. Neural Dev. 2011.
Abstract
Background: Serotonin (5-HT) is a potent regulator of adult neurogenesis in the crustacean brain, as in the vertebrate brain. However, there are relatively few data regarding the mechanisms of serotonin's action and which precursor cells are targeted. Therefore, we exploited the spatial separation of the neuronal precursor lineage that generates adult-born neurons in the crayfish (Procambarus clarkii) brain to determine which generation(s) is influenced by serotonin, and to identify and localize serotonin receptor subtypes underlying these effects.
Results: RT-PCR shows that mRNAs of serotonin receptors homologous to mammalian subtypes 1A and 2B are expressed in P. clarkii brain (referred to here as 5-HT1α and 5-HT2β). In situ hybridization with antisense riboprobes reveals strong expression of these mRNAs in several brain regions, including cell clusters 9 and 10 where adult-born neurons reside. Antibodies generated against the crustacean forms of these receptors do not bind to the primary neuronal precursors (stem cells) in the neurogenic niche or their daughters as they migrate, but do label these second-generation precursors as they approach the proliferation zones of cell clusters 9 and 10. Like serotonin, administration of the P. clarkii 5-HT1α-specific agonist quipazine maleate salt (QMS) increases the number of bromodeoxyuridine (BrdU)-labeled cells in cluster 10; the P. clarkii 5-HT2β-specific antagonist methiothepin mesylate salt (MMS) suppresses neurogenesis in this region. However, serotonin, QMS and MMS do not alter the rate of BrdU incorporation into niche precursors or their migratory daughters.
Conclusion: Our results demonstrate that the influences of serotonin on adult neurogenesis in the crayfish brain are confined to the late second-generation precursors and their descendants. Further, the distribution of 5-HT1α and 5-HT2β mRNAs and proteins indicate that these serotonergic effects are exerted directly on specific generations of neuronal precursors. Taken together, these results suggest that the influence of serotonin on adult neurogenesis in the crustacean brain is lineage dependent, and that 5-HT1α and 5-HT2β receptors underlie these effects.
Figures
Figure 1
The neurogenic system in the adult crayfish brain. (A) Diagram of the crayfish brain. The soma clusters 9 and 10 (circled) flank two prominent neuropil regions of the deutocerebrum, the olfactory (OL) and accessory (AL) lobes. The OL is the primary olfactory processing area in the crustacean brain and is functionally equivalent to the olfactory bulb. The AL is a higher order processing area that integrates olfactory, visual and mechanosensory information [8,9]. (B) Serotonin immunostaining of a crayfish brain. Each dorsal giant neuron (DGN; arrow) innervates the ipsilateral OL and AL. The intense labeling of the OLs and ALs is due to the massive DGN projection to these areas. (cluster 9, cl9; cluster 10, cl10) (C) Confocal image of the ventral surface of the crayfish P. clarkii brain labeled immunocytochemically for 5-bromo-2-deoxyuridine (BrdU; green) and glutamine synthetase (blue), and counterstained with propidium iodide (red), a marker of nucleic acids. BrdU-labeled cells can be observed in the migratory streams (long arrows indicate direction of movement) and within both the lateral proliferation zone (LPZ) and medial proliferation zone (MPZ). The LPZ supplies cells to cluster 10, where they will differentiate into olfactory projection neurons. The MPZ supplies cells to cluster 9, where they will differentiate into local olfactory interneurons. (D) Model summarizing our current view of events leading to the production of new olfactory interneurons in adult crayfish. Neuronal precursor (first generation) cells exhibiting glial characteristics reside within a neurogenic niche where they divide symmetrically. Their daughters (second-generation precursors) migrate along tracts created by the fibers of the niche cells towards either the LPZ or the MPZ. At least one more division will occur in the LPZ and MPZ before the progeny (third- and subsequent-generations) differentiate into neurons. Scale bars: 200 μm (B); 100 μm (C). Panels (A, D) adapted from Sullivan et al. [11].
Figure 2
The influence of serotonin on the lineage of neuronal precursors. (A) 5-HT does not alter the number of BrdU-labeled cells in the niches and migratory streams in the brains of treated crayfish (dark gray vertical bar) relative to untreated controls (light gray bar). (B) A _t_-test (P < 0.0005) reveals significant increases in the number of BrdU-labeled cells in cluster 10 in 5-HT (10-9 M) treated crayfish (P. clarkii) compared with untreated controls. Error bars represent standard error of the mean; n = numbers of lateral proliferation zones per group.
Figure 3
5-HT receptor mRNAs are expressed in the brain of the crayfish P. clarkii. RT-PCR was performed on total RNA sampled from P. clarkii brains. The expected PCR products based on GenBank P. clarkii sequences are 515 bp for 5-HT1α mRNA (lane 2), 546 bp for 5-HT2β (lane 3) and 427 bp for 18S rRNA (lane 4). Lane 1, 1-kb DNA ladder.
Figure 4
In situ hybridization for 5-HT1α mRNA in whole mount brains (n = 6) of P. clarkii. (A-H) Labeling for the 5-HT1α transcript with the antisense riboprobe. (A) Ventral view of the brain after hybridization. (B) Dorsal view of the brain after hybridization. Cell clusters (cl) positive for hybridization signals were darkly stained. Selected cell clusters are more highly magnified in (C-G). Intense 5-HT1α message labeled with anti-sense riboprobe (purple to black) is found in soma clusters 6 (C), 9 (D), 10 (E), 16 (F), 17 (G), and 7, 8, 11, 12, 13 (not shown). (I) The sense probe indicated no detectable signal. (H) In some preparations, a lower 5-HT1α expression area was found (arrow) in the area where the glutamine synthetase-labeled migratory stream (brown, indicated with arrowheads just above the stream) inserts into cluster 10. Scale bars: 300 μm (A, B, H); 100 μm (C-G); 500 μm (I). AL, accessory lobe; OL, olfactory lobe. The asterisk in (E) marks the area in cluster 10 with reduced 5-HT1α mRNA expression.
Figure 5
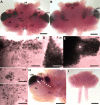
Whole mount in situ hybridization for P. clarkii 5-HT2β (n = 5). (A) Low magnification ventral view of the brain. (B) Low magnification dorsal view of the brain. (C-F) More highly magnified views of selected cell clusters (cl). Intense 5-HT2β message (purple to black) is found in soma clusters 9 (C), 10 (D), 11 (B, arrows; E) and 17 (F) with antisense riboprobe. (G, H) Combined with immunofluoresence for GS (H, red), it is clear that cells in the niche and streams are not labeled (G). The red dotted line is placed just below the outline of the niche and streams that are visualized in (H). Arrows in (G, H) mark the same point where the stream inserts into cluster 10. (I) The sense probe indicated no detectable signal. Scale bars: 300 μm (A, B); 100 μm (C-F); 200 μm (G-H); 500 μm (I). AL, accessory lobe.
Figure 6
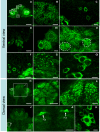
Immunohistochemistry with antibody specific against P. clarkii 5-HT1α receptor reveals protein expression in cell soma clusters and synaptic neuropil regions (n = 11). (A, H) Low magnification images show the overall staining pattern in ventral (A) and dorsal (H) views of the brain. (C-Di, F-Gi, K) Higher magnification images of staining in clusters 6 (C), 9 (G, Gi), 10 (F), 11 (K) and 16 (D, Di) are also shown. (B, E, I-Ji) Intensive 5-HT1α protein is also found in neuropils, such as in the anterior (AMPN) and posterior median protocerebral neuropils (PMPN) (B), accessory lobe (AL; (E) with two AL spherical glomeruli circled), olfactory lobe (OL; I, Ii), and protocerebral bridge (PCB; arrows in (J, Ji)). Scale bars: 400 μm (A, H); 100 μm (J); 50 μm (A, C, G, I, Ji); 20 μm (C, F); 10 μm for all other panels.
Figure 7
The region in cluster 10 with reduced 5-HT1α mRNA expression is sometimes found deep within the proliferation zone of cluster 10. (A-C) Coronal serial sections (20 μm each) from ventral (A) to dorsal (C) through cluster 10 reveal a relatively low expression area in cluster 10. The inset in (A) shows labeling (arrows) for 5-HT1α mRNA within the lower expression region indicated. (D-F) Combined with BrdU-labeling, BrdU-positive cells (blue) are found localized in the area of reduced mRNA expression (red). Scale bars: 20 μm (A, inset); 100 μm for all other panels; the scale bar in (C) also applies to (A, B); the scale bar in (F) also applies to (D, E). AL, accessory lobe; cl, cluster; OL, olfactory lobe.
Figure 8
Double immunofluoresence for 5-HT1α (green)/BrdU (red) (n = 6 brains), or 5-HT1α (green)/glutamine synthetase (blue) (n = 4 brains), reveals the expression of 5-HT1α protein in S phase cells in the distal streams near the proliferation zones, and in the proliferation zones themselves. (A, B) Cells in the neurogenic niche (A) and proximal and medial parts of the migratory streams (B) do not label for the receptor. (E-G) Some cells in the distal end of the stream near the proliferation zones (E), as well as cells in the proliferation zones of cluster 9 (F) and cluster 10 (G) show cytoplasmic labeling for the receptor (arrows). (C, D) Some BrdU-labeled cells in clusters 9 (C) and 10 (D) are not immunoreactive for the 5-HT1α receptor. Scale bars: 30 μm (B); 20 μm (A, C-G). AL, accessory lobe.
Figure 9
Immunohistochemistry with antibody specific against P. clarkii 5-HT2β receptor reveals protein expression in some cell soma clusters (n = 14 brains). (A) Low magnification images show the overall staining pattern seen from the dorsal side. The large arrow points to the paired medial giant neurons, small arrows indicate the locations of clusters 6, 16, and 17, and arrowheads point to the MPZ and LPZ. (B-F) Higher magnification images of staining in the medial giant cells and their fibers (B, arrows), cluster 6 (B, arrowheads), cluster 17 (C), cluster 16 (D), the LPZ of cluster 10 (E) and the MPZ of cluster 9 (F). Scale bars: 200 μm (A); 50 μm in the other panels. AL, accessory lobe; cl, cluster; OL, olfactory lobe.
Figure 10
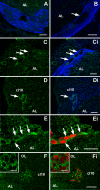
Double immunofluoresence for 5-HT2β (green)/glutamine synthetase (blue) (n = 4 brains) or 5-HT2β (green)/BrdU (red) (n = 4 brains) reveals the expression of 5-HT2β protein in S phase cells in the distal streams near the proliferation zones, and in the proliferation zones themselves. (A, B) Cells in the neurogenic niche (A) and proximal and medial parts of the migratory streams (B, arrow indicates a GS-positive cell in the proximal part of the stream) do not label for the receptor. (C-Fi) Some cells in the distal end of the stream near the proliferation zones (arrows in (C, Ci, E, Ei)), as well as cells in the proliferation zones of cluster 10 (arrows in (D, Di, F, Fi); insets show more highly magnified proliferation zones) show cytoplasmic labeling for the receptor. The left panels (C, D, E, F) show labeling for the 5-HT2β receptor; the companion panels on the right (Ci, Di, Ei, Fi) are composites showing receptor immunoreactivity merged with other antibody labels. Scale bars: 50 μm (F, Fi); 10 μm ((B) and insets); 20 μm in the other panels.
Figure 11
Pharmacological treatment of serotonin receptors. (A) Dose-response curve for the 5-HT1α agonist quipazine maleate salt (QMS) and levels of BrdU incorporation in cells in the LPZ of the crayfish brain. The graph of mean BrdU-labeled cell counts versus QMS concentrations (10-11 to 10-5 M) demonstrates that the rate of cell proliferation in cluster 10 is increased after QMS treatment. One-way ANOVA followed by Tukey multiple comparison (P < 0.05) reveals significant differences at QMS levels of 10-9 M relative to control brains. n = number of cluster 10s per group. (B) QMS does not alter the number of BrdU-labeled cells in the niches and migratory streams in the brains of treated crayfish relative to untreated controls. (C) Dose-response curve for the 5-HT2β antagonist methiothepin mesylate salt (MMS) and levels of adult neurogenesis in the LPZ of crayfish brains. The graph of BrdU-labeled cell counts versus MMS concentrations (10-10 to 10-4 M) demonstrates that the rate of cell proliferation in cluster 10 is decreased after blocking the function of 5-HT2β with MMS. One-way ANOVA followed by Tukey multiple comparison (P < 0.05) reveals significant differences at MMS concentrations of 10-5 to 10-9 M relative to control brains. n = number of cluster 10s per group. Same letter notation on the histograms indicates that there are no statistical differences among the groups; different letters indicate statistical significance. (D) MMS does not alter the number of BrdU-labeled cells in the niches and migratory streams in the brains of treated crayfish relative to untreated controls. Error bars represent standard error of the mean.
Figure 12
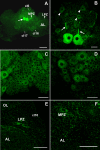
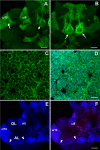
Immunocytochemical labeling for the serotonin transporter (n = 9 brains). (A-F) SERT is green in (A-D) and blue in (E-F). Structures with intense labeling for SERT include the cytoplasm of neurons in clusters 9 and 10 (A, C-F), the medial giant neurons (A, arrowhead; B, arrows), and the neurogenic niche and migratory streams (E-F). A lower level of immunoreactivity is seen in the LPZ (A, arrow) relative to surrounding cells in cluster 10, similar to the distribution of 5-HT1α mRNA (Figure 7). (C) SERT labeling of cells in cluster 10. (D) DAPI (4',6-diamidino-2-phenylindole, cyan in (D)) labeling of DNA merged with SERT labeling shown in (C). (E) SERT labeling of clusters 9 and 10, and the neurogenic niche and streams (arrowheads). (F) BrdU labeling (red) merged with SERT labeling shown in (E). Scale bars: 200 μm (A, B, E, F); 20 μm (C, D). AL, accessory lobe; cl, cluster; OL, olfactory lobe.
Similar articles
- From Blood to Brain: Adult-Born Neurons in the Crayfish Brain Are the Progeny of Cells Generated by the Immune System.
Beltz BS, Benton JL. Beltz BS, et al. Front Neurosci. 2017 Dec 7;11:662. doi: 10.3389/fnins.2017.00662. eCollection 2017. Front Neurosci. 2017. PMID: 29270102 Free PMC article. Review. - Primary neuronal precursors in adult crayfish brain: replenishment from a non-neuronal source.
Benton JL, Zhang Y, Kirkhart CR, Sandeman DC, Beltz BS. Benton JL, et al. BMC Neurosci. 2011 Jun 2;12:53. doi: 10.1186/1471-2202-12-53. BMC Neurosci. 2011. PMID: 21635768 Free PMC article. - Adult neurogenesis in the crayfish brain: proliferation, migration, and possible origin of precursor cells.
Zhang Y, Allodi S, Sandeman DC, Beltz BS. Zhang Y, et al. Dev Neurobiol. 2009 Jun;69(7):415-36. doi: 10.1002/dneu.20717. Dev Neurobiol. 2009. PMID: 19294644 Free PMC article. - Adult neurogenesis in the decapod crustacean brain: a hematopoietic connection?
Beltz BS, Zhang Y, Benton JL, Sandeman DC. Beltz BS, et al. Eur J Neurosci. 2011 Sep;34(6):870-83. doi: 10.1111/j.1460-9568.2011.07802.x. Eur J Neurosci. 2011. PMID: 21929622 Free PMC article. Review. - First-generation neuronal precursors in the crayfish brain are not self-renewing.
Benton JL, Chaves da Silva PG, Sandeman DC, Beltz BS. Benton JL, et al. Int J Dev Neurosci. 2013 Nov;31(7):657-66. doi: 10.1016/j.ijdevneu.2012.11.010. Epub 2012 Dec 5. Int J Dev Neurosci. 2013. PMID: 23219763 Free PMC article. Review.
Cited by
- Identification and Characterization of 5-HT Receptor 1 from Scylla paramamosain: The Essential Roles of 5-HT and Its Receptor Gene during Aggressive Behavior in Crab Species.
Huang X, Fu Y, Zhai W, Wang X, Zhou Y, Liu L, Wang C. Huang X, et al. Int J Mol Sci. 2023 Feb 20;24(4):4211. doi: 10.3390/ijms24044211. Int J Mol Sci. 2023. PMID: 36835632 Free PMC article. - Identification of putative amine receptor complement in the eyestalk of the crayfish, Procambarus clarkii.
Christie AE. Christie AE. Invert Neurosci. 2019 Sep 23;19(4):12. doi: 10.1007/s10158-019-0232-z. Invert Neurosci. 2019. PMID: 31549228 - How the Body Talks to the Brain; Peripheral Mediators of Physical Activity-Induced Proliferation in the Adult Hippocampus.
Bolijn S, Lucassen PJ. Bolijn S, et al. Brain Plast. 2015 Oct 9;1(1):5-27. doi: 10.3233/BPL-150020. Brain Plast. 2015. PMID: 29765833 Free PMC article. Review. - From Blood to Brain: Adult-Born Neurons in the Crayfish Brain Are the Progeny of Cells Generated by the Immune System.
Beltz BS, Benton JL. Beltz BS, et al. Front Neurosci. 2017 Dec 7;11:662. doi: 10.3389/fnins.2017.00662. eCollection 2017. Front Neurosci. 2017. PMID: 29270102 Free PMC article. Review.
References
- Marino AG, Russo IC. Serotonin: New Research. Hauppage, NY: Nova Science Publishers; 2009.
- Kempermann G. Adult Neurogenesis: Stem Cells and Neuronal Development in the Adult Brain. USA: Oxford University Press; 2006.
Publication types
MeSH terms
Substances
LinkOut - more resources
Full Text Sources


